
Practical skills: Paper 4 Alternative to Practical
Graphs: axes, best-fit lines, gradients and intercepts
In this note
- AO3Draw axes the right way round, labelled quantity / unit, with scales that fill at least half the grid.
- AO3Plot points to half a small square with neat crosses.
- AO3Draw ONE thin best-fit line or smooth curve with points balanced either side; circle and ignore an anomaly.
- AO3Find a gradient with a large triangle shown on the graph, and an intercept, with units.
- AO3Read values off a graph by interpolation and extrapolation, showing the construction lines.
- AO3Say what the shape shows: proportional, linear, or a curve.
Before you start: tables and calculations.
Rules to learn
Axes and scales
Four marks for a graph in every paper: axes, scales, plotting, line. Two of them are earned before you plot a single point.
General methodHow to set up the axes
- "Plot A against B": A goes on the y-axis (up), B on the x-axis (across).
- Label each axis with the quantity and unit from the table heading: V / V, I / A.
- Find the largest and smallest values of each quantity.
- Pick a scale of 1, 2 or 5 (or 0.1, 0.2, 0.5, 10, 20, 50…) per big square so the points spread over MORE than half of the grid in both directions.
- Start at 0 only if the question says "start both axes at the origin" or you need the intercept; otherwise a false origin is fine if it helps the spread.
- Number the big squares, evenly.
| Scale per big square | Verdict | Why |
|---|---|---|
| 1, 2, 5, 10, 0.2 … | good | easy to find half a small square |
| 3, 6, 7, 0.3 … | loses the mark | "awkward scales" - plots hard to place and to check |
| the readings themselves at equal spacing (20, 40, 60, 80, 100 then 150) | loses most marks | the scale is not linear: the line looks straight whatever the data |
| points squashed into one corner | loses the mark | the points must cover at least half the grid |
Try it yourself
Show answer
Answer 0.1 A
Show answer
Answer T²
Plotting points
Each point must be within half a small square of where it should be. Use a sharp pencil and a neat small cross (×) or a dot with a small circle. Big blobs cannot be judged and lose the mark ("precise plots").
The best-fit line or curve
Real readings scatter a little. The best-fit line goes through the middle of them: roughly as many points above as below, spread along its length. It is ONE thin continuous line drawn with a ruler (or one smooth freehand curve) - never dot-to-dot.
| Do | Don't |
|---|---|
| one thin line with a sharp pencil | a thick line or two lines |
| balance points above and below the line | force the line through the origin when the points don't go there |
| a smooth curve when the points clearly curve | join the dots with straight pieces |
| circle an anomaly and ignore it for the line | let one odd point drag the line |
The examiners' test: "could I draw a significantly better line, using these points, under examination conditions?" If yes, the line mark is lost.
Finding a gradient
General methodHow to find the gradient of a straight line
- Draw a large triangle on the LINE: its base at least half the length of the line.
- Choose corners where the line crosses a grid line, so they are easy to read (not your data points, unless they sit exactly on the line).
- Read both coordinates: \((x_1, y_1)\) and \((x_2, y_2)\).
- Gradient = \(\dfrac{y_2-y_1}{x_2-x_1}\). Show the triangle and the working on the graph.
- Unit = y-axis unit / x-axis unit. A line going down has a negative gradient.
Example Find the gradient of the line above.
Big triangle on the line, read two points, Δy ÷ Δx, unit.
- \(\Delta y=12.0-2.0=10.0\) cm, \(\Delta x=6.0-1.0=5.0\) N
- gradient \(=\dfrac{10.0}{5.0}=2.0\) cm/N
Answer 2.0 cm/N
Try it yourself
Show answer
Answer 7.0 V/A
Show answer
Answer −0.10 °C/s
The intercept, and reading off a graph
For a straight line \(y=mx+c\), the y-intercept c is the value of y where x = 0. Read it straight off the y-axis only if the x-axis starts at 0. If it starts somewhere else (a false origin), extend the line on paper or calculate \(c=y-mx\) using a point on the line.
Interpolation = reading a value between your points; extrapolation = extending the line beyond them. Either way, draw the construction lines (across to the line, down to the axis) - they earn the mark.
Try it yourself
Show answer
Answer 3.0
What the shape tells you
| Shape | Means | How to say it |
|---|---|---|
| straight line through the origin | y is directly proportional to x | "straight line through the origin, so y is proportional to x" |
| straight line, not through the origin | linear relationship, NOT proportional | "straight line but it does not pass through the origin" |
| curve rising, levelling off | y increases with x, by less and less | "as x increases, y increases, at a decreasing rate" |
| curve falling, levelling off (e.g. cooling) | y decreases, more and more slowly | "the temperature falls quickly at first, then more slowly" |
From the past papers
Past paper 1
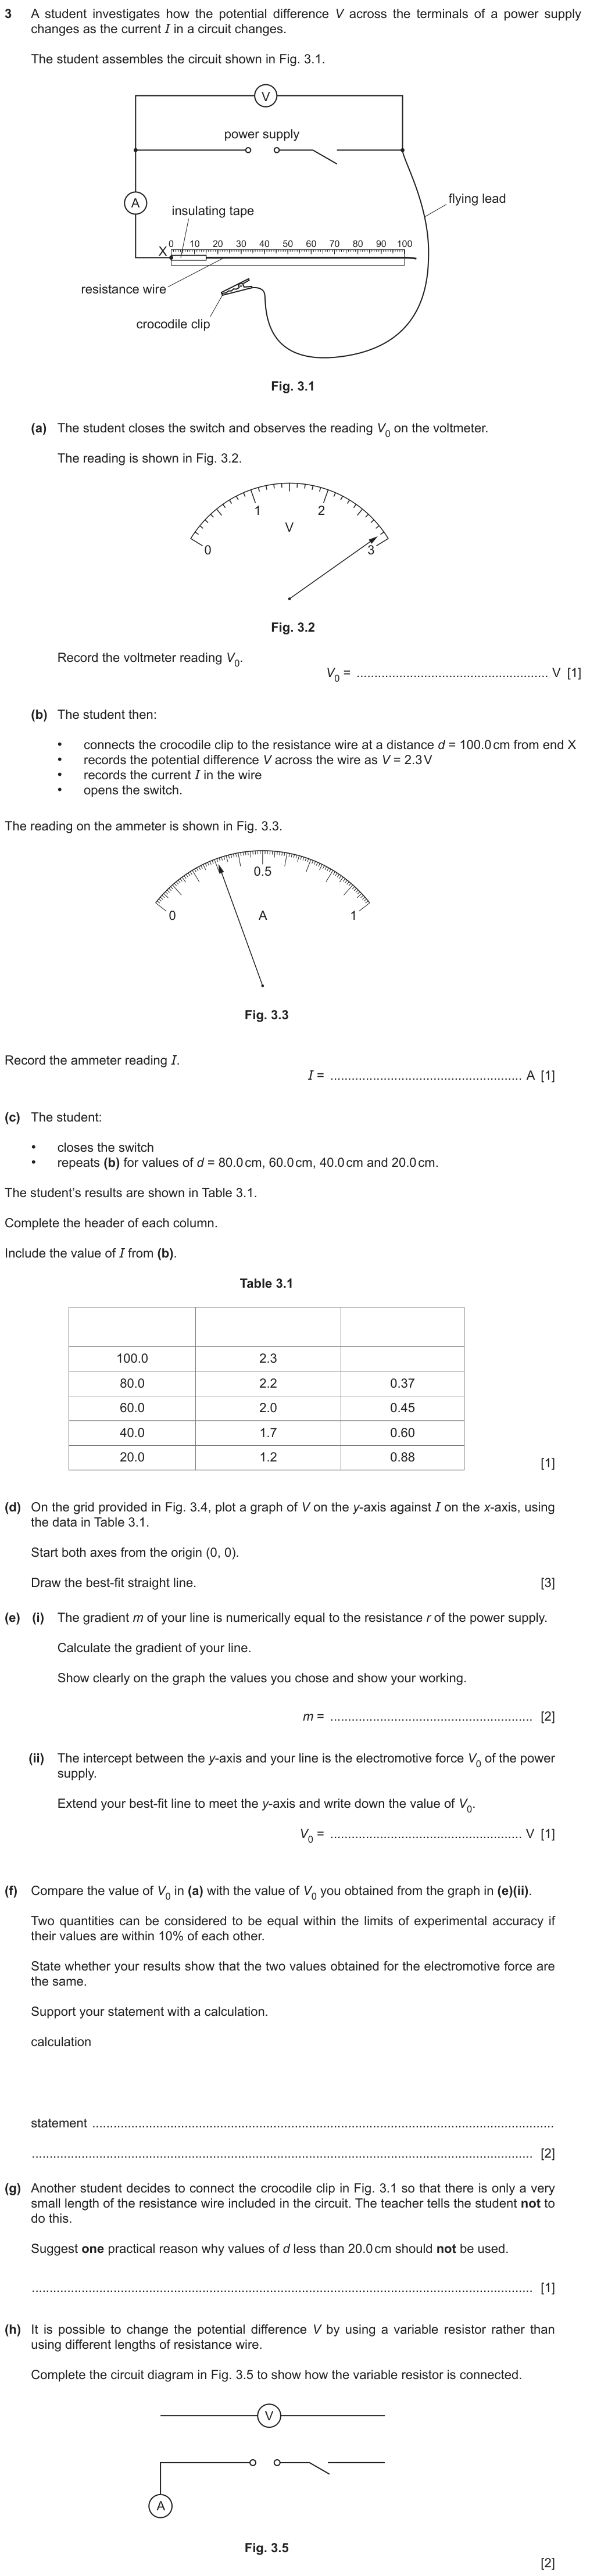
How to start: Two meter readings first (count the divisions), then the graph: "V against I" means V up the y-axis. Both axes start at 0, so the intercept can be read straight off.
✓ Show the answer have a go on paper first
- (a) The voltmeter needle is at 2.9 V: \(V_0=2.9\) V.
- (b) Count the small divisions between 0 and 0.5 A to find what one is worth, then count up to the needle: \(I=0.31\) A.
- (c) Headings d / cm, V / V, I / A, with 0.31 added to the I column.
- (d) Plot V (up, 0 to 3.5 V) against I (across, 0 to 1.0 A): five crosses, one thin straight line through the middle of them.
The finished graph: crosses, one thin line extended to the V axis, and a large gradient triangle. - (e)(i) Triangle on the line from I = 0.20 A to 0.90 A: \(m=\dfrac{1.14-2.51}{0.90-0.20}=-1.95\), so r ≈ 1.9 Ω (ignore the minus sign; the scheme accepts 1.8 to 2.0).
- (e)(ii) Extend the line to I = 0: \(V_0=2.9\) V.
- (f) 2.9 V and 2.90 V: the difference is far less than 10% of 2.9 V (0.29 V), so yes, they are the same within the limits of experimental accuracy.
- (g) With very little wire the current is large: the wire gets hot (or the current goes beyond the ammeter's range).
- (h) Draw a variable resistor (rectangle with an arrow through it) in series with the ammeter, and the voltmeter across the supply.
| Part | Answer / working | Marks | Guidance |
|---|---|---|---|
| (a) | V₀ = 2.9(0) (V) | B1 | |
| (b) | I = 0.31 (A) | B1 | |
| (c) | all columns with correct units (and I = 0.31 A added) | B1 | |
| (d) | scales linear, not awkward and start from (0, 0) | B1 | |
| points plotted accurately, to the nearest ½ square | B1 | ||
| thin best-fit straight line drawn | B1 | ||
| (e)(i) | values / triangle indicated on the graph, ⩾ ½ distance between the extreme plotted points | B1 | |
| m = 1.8 to 2(.0) inclusive | B1 | ||
| (e)(ii) | candidate's intercept value ± ½ small square | B1 | |
| (f) | statement matches results (expect YES) | B1 | |
| correct calculation to support the statement using both values of V₀ | B1 | ||
| (g) | wire becomes (too) hot / current exceeds full-scale deflection of the ammeter / clips may touch, causing a short circuit | B1 | |
| (h) | correct symbol for variable resistor | B1 | |
| correct series connection and voltmeter in parallel with supply | B1 | ||
| Total: 14 marks | |||
Examiner tip Graph, gradient and intercept are 6 of the 14 marks. The gradient mark needs the triangle (or the two points) SHOWN on the graph.
What the line mark needs
Plot a graph of V on the y-axis against I on the x-axis … Start both axes from the origin (0, 0). Draw the best-fit straight line.
- thin best-fit straight line
- points balanced either side
- line drawn with a ruler, one continuous line
- a line joining the first and last points regardless of the rest
- dot-to-dot
- a thick or double line
- a line forced through the origin
The scheme's test is whether a significantly better line could be drawn through the same points. The reports list dot-to-dot lines, lines forced through the origin and small gradient triangles as the commonest losses.
From: 5054/42/O/N/23 Q3 scheme; 0625 June 2024 and 5054 November 2023 reports
Type 1 Plot and draw
"Plot a graph of … Draw the best-fit line." (3-4 marks)
Spot it a blank grid.
- Axes the right way, quantity / unit.
- Scale 1, 2, 5 filling half the grid.
- Plot to ½ square.
- One thin best-fit line.
Type 2 Gradient
"Determine the gradient. Show clearly on the graph how you obtained the necessary information." (2 marks)
Spot it "gradient".
- Triangle ≥ half the line, on the line.
- Read 2 points.
- Δy/Δx with unit.
Type 3 Intercept / read-off
"Use your graph to find … when …" (1-2 marks)
Spot it a value the table does not have.
- Construction lines to the line and the axis.
- Read to ½ small square.
Type 4 What does the graph show?
"Does your graph show that y is proportional to x? Justify." (2 marks)
Spot it "proportional".
- Yes only if it is a straight line through the origin.
- Say both features (straight, through origin) or which one fails.
Mistakes to avoid
- ✗ V on the x-axis for "V against I"✓ V on the y-axisThe first-named quantity goes up.
- ✗ scale of 3 per big square✓ 1, 2 or 5"Awkward scales" lose the mark.
- ✗ a tiny triangle✓ triangle at least half the lineSmall triangles give inaccurate gradients (0625 June 2024 report).
- ✗ using two data points that are not on the line✓ points read from the line
- ✗ gradient with no unit✓ cm/N, °C/s, V/A
- ✗ reading the intercept off a false origin✓ extend to x = 0 or use c = y − mx
Summary
- "Plot y against x": y up. Labels quantity / unit.
- Scales of 1, 2 or 5 per big square, points filling at least half the grid.
- Plot to half a small square; one thin best-fit line, anomalies circled.
- Gradient: big triangle on the line, shown on the graph, Δy/Δx with units.
- Proportional = straight line through the origin.
If you see …
- "Show clearly on the graph"draw the triangle or construction lines.
- "start both axes at the origin"0 on both, then read c directly.
- "proportional?"straight AND through the origin.
Practice
Practice: easy, medium, hard
Easy
Show answer
Answer 0.50
Show answer
Answer cm/N
Show answer
Answer yes
Medium
Guide me
What is it asking? a gradient
What do we know? two points on the line
Plan Δθ ÷ Δt; it falls, so negative
Show working
- Δθ = 42 − 72 = −30 °C
- Δt = 300 s
- −30 ÷ 300
Answer −0.10 °C/s
Guide me
What is it asking? c
What do we know? y = mx + c
Plan c = y − mx
Show working
- \(3.13-0.032\times20=3.13-0.64\)
Answer 2.49
Guide me
What is it asking? a scale
What do we know? range 56
Plan try 5 or 10 per square
Show answer
Answer 10 per big square (from 0, uses 8 squares) or 5 per big square from 20
Hard
Show working
- \((1.5-3.6)/(0.85-0.25)=-2.1/0.60\)
Answer −3.5 V/A
| Part | Answer / working | Marks | Guidance |
|---|---|---|---|
| Δy/Δx with both values | M1 | ||
| −3.5 | A1 | ||
| V/A (Ω) | B1 | ||
| Total: 3 marks | |||
Show working
- l = 24.8 × 1.50
Answer 37.2 cm
| Part | Answer / working | Marks | Guidance |
|---|---|---|---|
| uses gradient × T² | M1 | ||
| 37.2 cm | A1 | ||
| Total: 2 marks | |||
Show answer
Answer No: it is a straight line but it does not pass through the origin
| Part | Answer / working | Marks | Guidance |
|---|---|---|---|
| No | B1 | ||
| reason: does not pass through the origin (intercept 0.6) | B1 | ||
| Total: 2 marks | |||
Can I do this?
- I put the axes the right way round, labelled quantity / unit, with good scales.
- I plot points to half a small square.
- I draw one thin best-fit line or smooth curve and circle anomalies.
- I find gradients with a large triangle on the line, with the unit.
- I find intercepts and read values off with construction lines.
- I can say what a graph's shape shows, including proportionality.
Anything unticked: revise that section first. All ticked: take the quiz.
Quiz
The multiple-choice and guided questions need JavaScript. The concept checks and exam practice below work without it.
Your progress on this note is saved when JavaScript is on.