
Physical quantities and units
Errors, precision, accuracy and uncertainties
On this page
- What you need to be able to do
- Systematic and random errors
- Precision and accuracy
- Uncertainty: absolute, fractional, percentage
- Combining uncertainties
- Writing the final answer
- Case by case: every kind of uncertainty question
- Methods: three ways to the same uncertainty
- Graphs: seeing errors on a plot
- Try it: precision, accuracy, combining
- Mark-scheme focus
- Worked examples
- Summary
- Can I do this?
- Quiz
What you need to be able to do
- 1.3.1Understand and explain the effects of systematic errors (including zero errors) and random errors in measurements.
- 1.3.2Understand the distinction between precision and accuracy.
- 1.3.3Assess the uncertainty in a derived quantity by simple addition of absolute or percentage uncertainties.
Before you start: prefixes and significant figures. Next: Scalars and vectors.
Systematic and random errors
No measurement is perfect. The difference between a measured value and the true value is an error. There are two kinds, and they behave very differently.
| Systematic error | Random error | |
|---|---|---|
| Effect on readings | all shifted the same way | scattered either side of the true value |
| Examples credited in mark schemes | zero error (meter or calipers doesn't read zero when it should); wrongly calibrated scale (meter always 5% high; ruler graduations too far apart; ruler expanded by heat) | reading a scale from different angles (parallax); wrongly interpolating between scale divisions; a meter needle that sticks; a fluctuating reading |
| Affects mainly | accuracy | precision |
| How to reduce | check for and correct the zero error; recalibrate against a reliable instrument | take several readings and average; for a wire, measure at different places along it and around it |
| Does averaging help? | No: every reading is off by the same amount | Yes |
Zero errors: watch the sign
If an instrument reads x0 when it should read zero, subtract that zero reading from every measurement: true value = reading − zero reading.
! A negative zero error
A micrometer reads (−0.05 ± 0.02) mm with the jaws closed and (+1.03 ± 0.02) mm on a wire. What is the diameter? 9702/11/M/J/21 Q5
Askedthe wire's diameter with its uncertaintyKnowzero reading −0.05 mm, wire reading +1.03 mmRoutediameter = reading − zero reading; add the two ± values
- The jaws move from −0.05 mm to +1.03 mm: diameter = 1.03 − (−0.05) = 1.08 mm.
- Both readings are uncertain, so add: ± (0.02 + 0.02) = ± 0.04 mm.
- (1.08 ± 0.04) mm
The June 2021 report: some ignored the minus sign (1.03 − 0.05 = 0.98 mm), others kept ± 0.02 mm.
Precision and accuracy
Think of darts. They are independent: you can have either without the other. Systematic error moves the whole group off the bullseye, so it spoils accuracy; random error spreads the group out, so it spoils precision.
Uncertainty: absolute, fractional, percentage
An uncertainty says how far the true value might be from the value you quote. "\(l = 25.0 \pm 0.1\) cm" means the true length is probably between 24.9 cm and 25.1 cm. The same uncertainty can be written three ways:
Absolute uncertainty
\[ \Delta x \]
Same unit as the quantity. \(l = 25.0 \pm 0.1\) cm → \(\Delta l = 0.1\) cm
Fractional uncertainty
\[ \frac{\Delta x}{x} \]
No unit. \(0.1 / 25.0 = 0.004\)
Percentage uncertainty
\[ \frac{\Delta x}{x} \times 100\% \]
No unit. \(0.004 \times 100 = 0.4\%\)
Moving between them
| You have | You want | Do this | Example |
|---|---|---|---|
| absolute \(\Delta x\) | percentage | \(\dfrac{\Delta x}{x} \times 100\) | \(\dfrac{0.1}{25.0} \times 100 = 0.4\%\) |
| percentage | absolute \(\Delta x\) | \(\dfrac{\%}{100} \times x\) | \(d = 0.0125\) m ± 1.6% → \(\Delta d = \dfrac{1.6}{100} \times 0.0125 = 2 \times 10^{-4}\) m 9702/22/M/J/19 Q1(a) |
| fractional | percentage | × 100 | 0.004 → 0.4% |
| percentage | fractional | ÷ 100 | 3.6% → 0.036 |
| percentage of a calculated result | its absolute uncertainty | work out the value first, then \(\dfrac{\%}{100} \times \text{value}\) | \(P = 12.0\) W ± 5% → \(\Delta P = 0.05 \times 12.0 = 0.6\) W |
Combining uncertainties
When you calculate a quantity from measured values, its uncertainty comes from theirs. Cambridge uses simple addition (the worst case). Learn these four rules; they are not on the formula sheet.
1 · Add or subtract: \(y = a + b\) or \(y = a - b\)
\[ \Delta y = \Delta a + \Delta b \]
Absolute uncertainties add, even when the quantities are subtracted.
2 · Multiply or divide: \(y = ab\) or \(y = a/b\)
\[ \frac{\Delta y}{y} = \frac{\Delta a}{a} + \frac{\Delta b}{b} \]
\[ \%y = \%a + \%b \]
Fractional or percentage uncertainties add, even when the quantities are divided.
3 · Power or root: \(y = a^n\)
\[ \%y = |n| \times \%a \]
- \(\%(d^2) = 2\,\%d\)
- \(\%(r^3) = 3\,\%r\)
- \(\%(1/T^2) = 2\,\%T\)
- \(\%\sqrt{a} = \tfrac12\,\%a\)
4 · Exact number: \(y = k\,a\)
\[ \%y = \%a \]
\(k\) = 2, π, ½, 4π² … is exact and adds nothing.
- \(\%(\pi d^2/4) = 2\,\%d\)
Put together, for any formula made of products, quotients and powers:
\[ y = \frac{k\,a^{p}\,b^{q}}{c^{r}} \quad\Longrightarrow\quad \%y = p\,\%a + q\,\%b + r\,\%c \]
Why percentages add for a product: if \(a\) is 2% too big and \(b\) is 3% too big, then \(ab\) is \(1.02 \times 1.03 = 1.0506\) times too big, about 5%. The tiny \(0.02 \times 0.03\) term is ignored. For a quotient the worst case is \(a\) too big and \(b\) too small, so the percentages still add.
Writing the final answer
Most uncertainty questions end with "give your answer with its absolute uncertainty, to an appropriate number of significant figures". Work out the value and its absolute uncertainty with all your figures, then round in this order:
- Round the absolute uncertainty to 1 significant figure. 0.1327 → 0.1; 311 → 300; 0.096 → 0.1.
- Look at which decimal place (or power of ten) that 1 figure sits in. 0.1 → the first decimal place; 300 → the hundreds.
- Round the value to that same place. 9.7477 → 9.7; 8739 → 8700.
- Write both with the same power of ten and one unit: (value ± uncertainty) unit.
| Calculated value | Calculated Δ | Δ to 1 s.f. | Value to the same place | Final answer |
|---|---|---|---|---|
| g = 9.7477 m s⁻² | 0.1327 | 0.1 (1st d.p.) | 9.7 | (9.7 ± 0.1) m s⁻² |
| R = 12.00 Ω | 0.68 | 0.7 (1st d.p.) | 12.0 | (12.0 ± 0.7) Ω |
| T = 2.0471 s | 0.0034 | 0.003 (3rd d.p.) | 2.047 | (2.047 ± 0.003) s |
| v = 15.04 m s⁻¹ | 0.096 | 0.1 (rounding moved it to the 1st d.p.) | 15.0 | (15.0 ± 0.1) m s⁻¹ |
| ρ = 8739 kg m⁻³ | 311 | 300 (hundreds) | 8700 | (8.7 ± 0.3) × 10³ kg m⁻³ |
| E = 8.245 × 10⁹ Pa | 5.7% → 0.47 × 10⁹ | 0.5 × 10⁹ | 8.2 × 10⁹ | (8.2 ± 0.5) × 10⁹ Pa |
| λ = 5.832 × 10⁻⁷ m | 0.0461 × 10⁻⁷ | 0.05 × 10⁻⁷ | 5.83 × 10⁻⁷ | (5.83 ± 0.05) × 10⁻⁷ m |
Two more question types
? Which quantity contributes most to the uncertainty?
\(m \propto \dfrac{R^4}{L}\). R and L are both measured with a 2% uncertainty. Which contributes more to the uncertainty in m?
- Write the rule with the powers: \(\%m = 4\,\%R + 1\,\%L\).
- Contribution of R = 4 × 2% = 8%; of L = 1 × 2% = 2%.
- R, because its percentage uncertainty is multiplied by its power, 4.
The June 2023 report: you must say that the power multiplies the percentage. "R is raised to the power 4" on its own is not enough.
? Do two results agree?
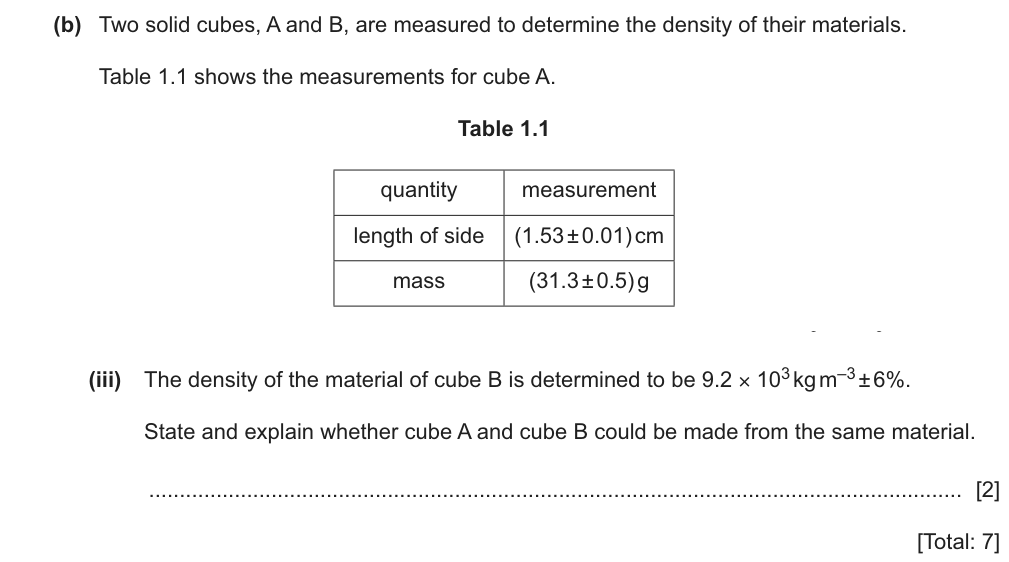
- Range of A: 8.7 × 10³ ± 4% = ± 0.35 × 10³ → 8.35 to 9.05 × 10³ kg m⁻³.
- Range of B: 9.2 × 10³ ± 6% = ± 0.55 × 10³ → 8.65 to 9.75 × 10³ kg m⁻³.
- The ranges overlap (8.65 to 9.05), so the cubes could be the same material.
Compare the ranges, not the two central values. Different-sized uncertainties don't matter; overlap does.
Case by case: every kind of uncertainty question
Every uncertainty question is one of these cases, or two of them joined together. Spot the case, then follow its steps.
1 Absolute given → find the percentage
A length is measured as (25.0 ± 0.1) cm. Find its percentage uncertainty.
Asked% uncertaintyKnowa value and its ± (absolute)Route% = Δ ÷ value × 100
- \(\%l = \dfrac{\Delta l}{l} \times 100 = \dfrac{0.1}{25.0} \times 100\)
- = 0.4%
2 Percentage given → find the absolute
A diameter is 0.0125 m with a percentage uncertainty of 1.6%. Find its absolute uncertainty.
Askedabsolute uncertaintyKnowa value and its %RouteΔ = % ÷ 100 × value, then round to 1 s.f.
- \(\Delta d = \dfrac{1.6}{100} \times 0.0125\)
- = 2 × 10⁻⁴ m (1 s.f.)
3 A sum
Two rods of lengths (12.4 ± 0.2) cm and (8.7 ± 0.1) cm are placed end to end. Find the total length.
Askedtotal length ± uncertaintyKnowtwo lengths each with ±Routeadding values → ADD the absolute uncertainties
- Value: 12.4 + 8.7 = 21.1 cm
- Rule 1: Δ = 0.2 + 0.1 = 0.3 cm
- (21.1 ± 0.3) cm
4 A difference (the trap)
A spring is (225 ± 2) mm long; with a load it is (250 ± 2) mm. Find the extension and its percentage uncertainty.
Askedextension and its %Knowtwo lengths each with ±Routesubtracting values → still ADD the absolute uncertainties, then find %
- Value: 250 − 225 = 25 mm
- Rule 1: Δ = 2 + 2 = 4 mm (add, even though you subtracted)
- % = 4/25 × 100 = 16%, from readings that were each under 1% 9702/12/O/N/22 Q3
Subtracting two similar numbers makes the percentage uncertainty huge, which is why you measure a large difference where you can.
5 A product, percentages given
\(P = VI\). V has an uncertainty of 2% and I of 3%. P is calculated as 12.0 W. Find P with its uncertainty.
AskedP with its uncertaintyKnow% of V and I; P = VIRoutemultiplying → add the %, then turn back into ±
- Rule 2: \(\%P = \%V + \%I = 2 + 3 = 5\%\)
- Absolute: \(\Delta P = 0.05 \times 12.0 = 0.6\) W
- (12.0 ± 0.6) W
6 A quotient, absolutes given
\(R = V/I\) with V = (6.0 ± 0.1) V and I = (0.50 ± 0.02) A. Find R with its uncertainty.
AskedR with its uncertaintyKnowV and I with absolute ±Routechange each to %, add the % (dividing), then back to ±
- Turn each into a percentage: \(\%V = \dfrac{0.1}{6.0} \times 100 = 1.7\%\), \(\%I = \dfrac{0.02}{0.50} \times 100 = 4.0\%\)
- Rule 2 (still add for a divide): \(\%R = 1.7 + 4.0 = 5.7\%\)
- Value: R = 6.0/0.50 = 12.0 Ω; \(\Delta R = 0.057 \times 12.0 = 0.68\) Ω → 0.7 Ω (1 s.f.)
- (12.0 ± 0.7) Ω
7 A power
A wire has diameter (2.50 ± 0.02) mm. Find its cross-sectional area \(A = \pi d^2/4\) with its uncertainty.
Askedarea with its uncertaintyKnowdiameter ± ; A = πd²/4Routepower 2 → double %d; π/4 is exact
- \(\%d = \dfrac{0.02}{2.50} \times 100 = 0.8\%\)
- Rules 3 and 4: \(\%A = 2 \times 0.8 = 1.6\%\) (π/4 is exact)
- Value: A = π × 2.50²/4 = 4.909 mm²; \(\Delta A = 0.016 \times 4.909 = 0.079\) → 0.08 mm²
- (4.91 ± 0.08) mm²
8 A whole formula
\(g = \dfrac{4\pi^2 L}{T^2}\) with L = (0.800 ± 0.002) m and T = (1.80 ± 0.01) s. Find g with its uncertainty.
Askedg with its uncertaintyKnowL and T with ±; g = 4π²L/T²Route%g = %L + 2 × %T; constants add nothing
- \(\%L = \dfrac{0.002}{0.800} \times 100 = 0.25\%\); \(\%T = \dfrac{0.01}{1.80} \times 100 = 0.56\%\)
- \(\%g = \%L + 2\,\%T = 0.25 + 1.11 = 1.36\%\) (4π² adds nothing; T² on the bottom still adds)
- Value: g = 4π² × 0.800 / 1.80² = 9.75 m s−2; \(\Delta g = 0.0136 \times 9.75 = 0.13\) → 0.1
- g = (9.7 ± 0.1) m s−2 (value rounded to the same decimal place as Δg)
9 Working backwards
Density \(\rho = m/V\) is found to ±5%. The mass was measured to ±2%. What was the percentage uncertainty in the volume?
Asked% uncertainty in VKnow%ρ and %m; ρ = m/VRoutewrite %ρ = %m + %V, then rearrange for %V
- Write the rule: \(\%\rho = \%m + \%V\)
- Rearrange: \(\%V = \%\rho - \%m = 5 - 2\)
- = 3%
This is solving the equation, not combining: you still add when you build \(\%\rho\) from its parts.
Methods: three ways to the same uncertainty
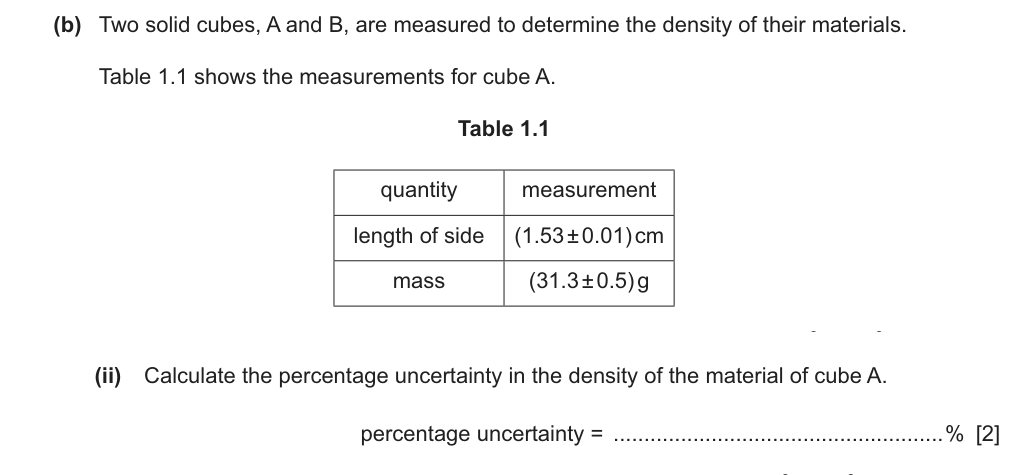
Method A: percentage rule
\(\rho = m / l^3\), so \(\%\rho = \%m + 3\,\%l\).
\[ \%m = \frac{0.5}{31.3} \times 100 = 1.60\% \qquad \%l = \frac{0.01}{1.53} \times 100 = 0.654\% \]
\[ \%\rho = 1.60 + 3(0.654) = 3.56\% \approx 4\% \]
Best for Paper 2: it is exactly the mark scheme's route (C1 for the method, A1 for 4%).
Method B: maximum and minimum
Work out the biggest and smallest possible density, making each measurement push the same way:
\[ \rho_{\max} = \frac{31.8}{1.52^3} = 9.055\ \text{g cm}^{-3} \qquad \rho_{\min} = \frac{30.8}{1.54^3} = 8.433\ \text{g cm}^{-3} \]
Absolute uncertainty = ½(9.055 − 8.433) = 0.311 g cm−3. As a percentage of \(\rho = 31.3/1.53^3 = 8.739\): \(0.311/8.739 \times 100 = 3.56\%\).
Best for odd formulas and Paper 1 checks. The June 2021 and March and November 2023 examiner reports suggest it: find the difference between the maximum and minimum values and halve it.
Method C: fractional uncertainties
Same rule without the ×100: \(\dfrac{\Delta\rho}{\rho} = \dfrac{0.5}{31.3} + 3 \times \dfrac{0.01}{1.53} = 0.0160 + 0.0196 = 0.0356\), i.e. 3.6% ≈ 4%.
Best when the next step is the absolute uncertainty: \(\Delta\rho = 0.0356 \times \rho\) directly. Mark schemes accept fractional or percentage uncertainties equally.
All three give 3.6%, which rounds to 4%. Careful with Method A's cube: the March 2025 report says some candidates multiplied the mass uncertainty by three instead of the length's.
Graphs: seeing errors on a plot
- Perfect meter: reading = true value, a straight line through the origin at 45°.
- Zero error: a parallel line that doesn't pass through the origin. The intercept (here +0.5 V) is the zero error: every reading is too high by the same amount.
- Wrongly calibrated scale: the line passes through the origin but its gradient is wrong. The error grows with the reading (9702/11/O/N/16 Q4: "a systematic error that varies with voltage").
- Random error would show as points scattered either side of a line, not as a shifted line.
On a graph of results, a systematic error shifts every point the same way, so the line misses where theory says it should go (e.g. a "proportional" graph that doesn't pass through the origin). Random error shows as scatter about the best-fit line. Error bars and worst-fit lines are practical-paper (Paper 3 and 5) skills, outside these Paper 1 and 2 notes.
Try it: precision, accuracy, combining
Precision vs accuracy
Teaching point: systematic error moves the whole cluster away from the true value (accuracy); random error spreads it out (precision). Change one at a time.
Turn on JavaScript to change the systematic and random error and take new sets of readings. The figure above shows the four combinations.
Random error → less precise
- readings scattered either side of the true value
- the spread (range) gets bigger
- the mean can still be accurate
- reduce it: repeat and average
Systematic error → less accurate
- every reading shifted the same way
- the readings can still be close together (precise)
- the mean is off the true value
- averaging does not help: correct the zero error or recalibrate
How Paper 1 asks it:
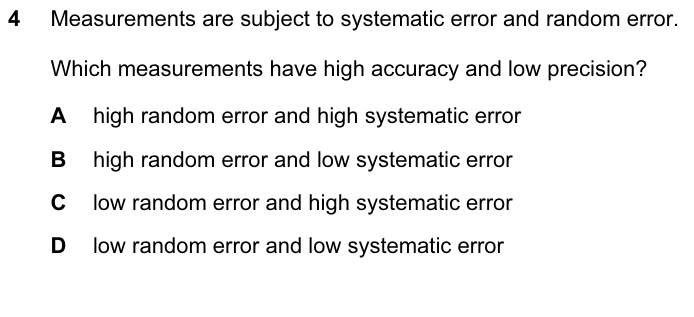
B. Low precision = lots of random error; high accuracy = little systematic error.
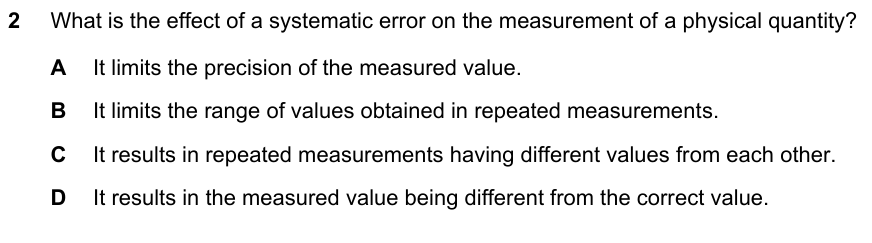
D. A systematic error moves the value away from the correct value (accuracy). A, B and C describe random error (precision).
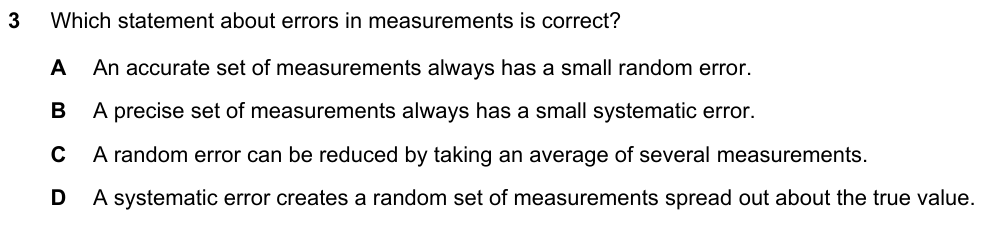
C. Averaging reduces random error. A and B mix the two up: accurate says nothing about the spread, precise says nothing about the shift.
Uncertainty combiner
Teaching point: sums and differences add absolute uncertainties; products, quotients and powers add (multiples of) percentage uncertainties. The final answer has its uncertainty to 1 s.f.
| Combination | x = 3.89 ± 0.02, y = 2.75 ± 0.02 |
|---|---|
| x + y | 6.64 ± 0.04 |
| x × y | 0.51% + 0.73% = 1.24% → 10.70 ± 0.13 → 10.7 ± 0.1 |
| y² | 2 × 0.73% = 1.45% → 7.56 ± 0.11 → 7.6 ± 0.1 |
Turn on JavaScript to try your own numbers and combinations.
Mark-scheme focus
Accuracy

"how close the (measured) value is to the true value"
- "how close the readings are to each other" (that's precision)
- "measured to more significant figures / decimal places"
- "measurements taken correctly", "from a good experiment"
Accuracy is about the true value. The March 2025 report says weak candidates thought accuracy was shown by the number of s.f.; November 2022 calls "measurements not taken correctly" too vague.
"Not accurate": "the (average of the) measurements is not close to the true value". "Accurate": "the closeness of the value(s) to the true value".
From: 9702/22/F/M/25 Q1(a), 9702/21/O/N/22 Q1(b)(ii), 9702/23/M/J/20 Q1(b)(ii), 9702/21/M/J/17 Q1(b)(ii).
Precision
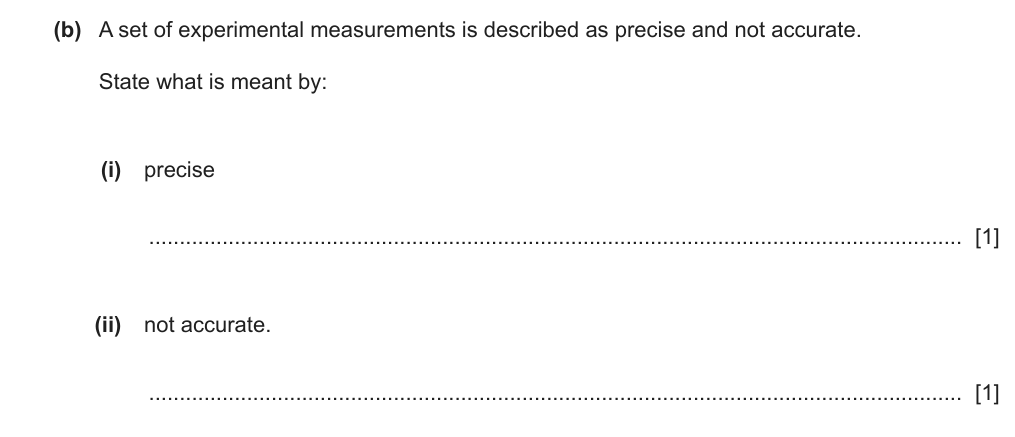
"the measurements have a small range" / "determined by the range of the measurements"
- "close to the true value"
- "measured with equipment that has small scale divisions" (wrong option in 9702/12/O/N/25 Q2)
- "each value has a low uncertainty"
Precision describes the spread of repeated readings. The June 2017 reports say many candidates described accuracy instead. A fine scale allows precise readings, but the definition is about the range.
"readings close to each other". (A 2016 scheme also accepted "the size of the smallest division", but recent papers treat that as wrong, so don't use it.)
From: 9702/21/O/N/22 Q1(b)(i), 9702/23/M/J/20 Q1(b)(i), 9702/22/M/J/17 Q1(c)(ii), 9702/12/O/N/25 Q2, 9702/23/M/J/16 Q2(b).
Systematic and random errors: give a real cause
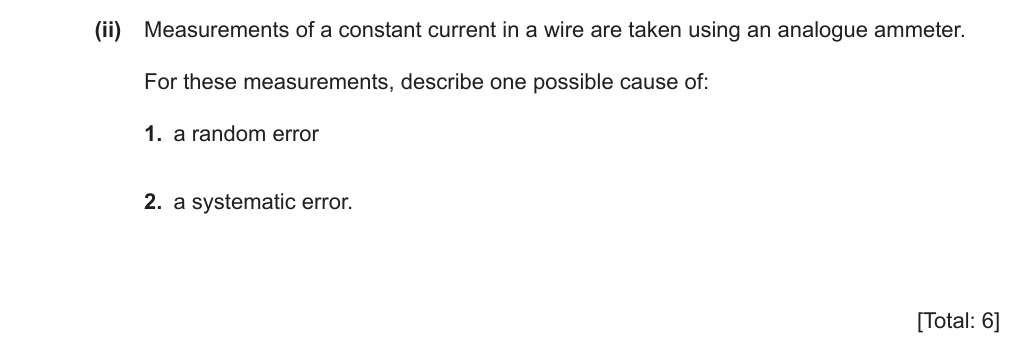
Systematic: "zero error", "wrongly calibrated scale". Random: "reading the scale from different angles", "(wrongly) interpolating between scale divisions".
"human error", "not recording the right reading", "faulty equipment", "not using the stop-watch correctly"
Vague answers don't say which kind of error or why. The June 2018 and June 2023 reports both reject them. Name the mechanism for the instrument in the question.
Systematic: "the reading is larger or smaller than the true reading by a constant amount". Random: "scatter in readings about the true reading" 9702/23/M/J/16 Q2.
From: 9702/21/M/J/20 Q1(b)(ii), 9702/23/M/J/18 Q1(a), 9702/21/O/N/24 Q1(c) and examiner reports.
Reducing random error (measuring a wire)
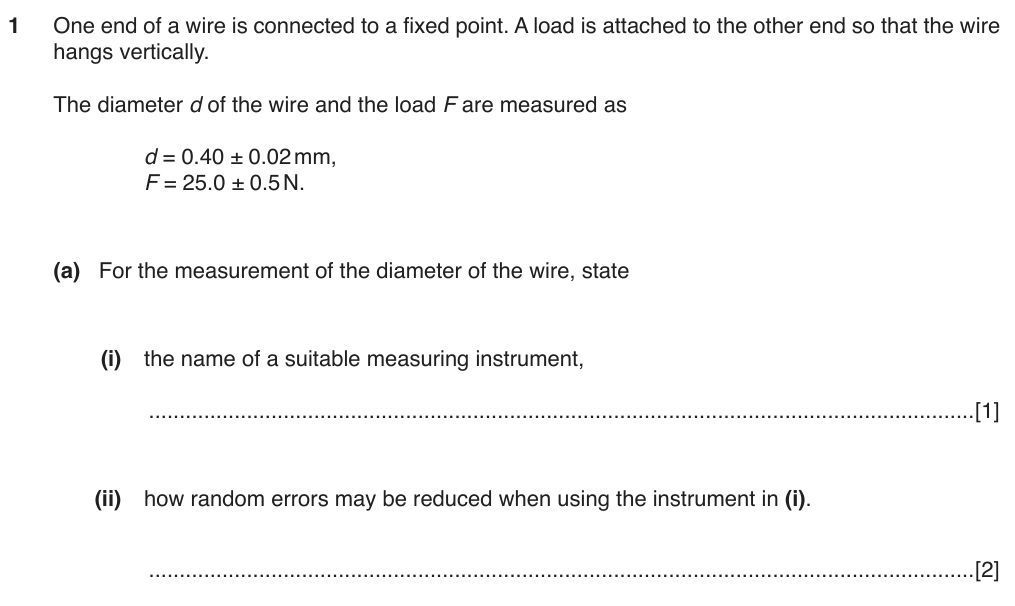
"take several readings (and average)" M1 + "along the wire / around the circumference" A1
"check the zero error", "calibrate the instrument", "repeat the experiment" (with no where or how)
Zero error and calibration are systematic (November 2017 report: "a common misconception"). The second mark is for where, because a wire's diameter varies along its length.
Instrument: "micrometer (screw gauge)" or "digital calipers" for a wire; "(vernier/digital) calipers" for about 10 cm; "metre rule / tape" for about 1 m (not just "rule").
From: 9702/22/O/N/17 Q1(a), 9702/22/M/J/10 Q1, 9702/21/M/J/11 Q1(a).
The final value ± uncertainty
\(\Delta\) to 1 s.f., value to the same decimal place: "d = 0.121 ± 0.004 m", "E = (8.2 ± 0.5) × 10⁹ Pa"
"0.12 ± 0.0036 m" (uncertainty to 2 s.f. and value to fewer d.p.); "8.245 ± 0.47 × 10⁹"; different powers of ten on value and uncertainty
The uncertainty already says the second decimal place is doubtful, so more digits are meaningless. This is the most-repeated comment in the reports (2016, 2019, 2021, 2022).
Some schemes allow 2 s.f. in the working (e.g. "0.17 (allow to 1 significant figure)"), but the final line should be 1 s.f.
From: 9702/21/O/N/16 Q1(b)(ii), 9702/22/M/J/22 Q1(b)(ii), 9702/21/M/J/19 Q1(b)(ii) and examiner reports.
How the marks are given
| Question type | Marks | Where the marks go |
|---|---|---|
| Percentage uncertainty in a derived quantity | 2 | C1 correct combination, with powers (e.g. 2.1 + 0.6 + 2 × 1.5); A1 value |
| Absolute uncertainty | 1 | A1 % × value (ecf from your %) |
| Value with uncertainty "to an appropriate number of s.f." | 2–3 | C1 value, C1 Δ = % × value, A1 final pair correctly rounded |
| Define precise / accurate | 1 each | B1 with the key phrase (small range / true value) |
| Give a systematic / random error | 1 each | B1 for a named cause that fits the instrument |
| Which contributes more | 1 | B1 must compare power × % for both |
Command words
| Command word | Example here |
|---|---|
| Calculate / Determine | "Determine the percentage uncertainty in g": show the combination, then the value |
| Explain | "Explain the difference between accuracy and precision": one statement each, with the key phrase |
| Describe | "Describe one possible cause of a random error": a specific cause for this instrument |
| Suggest | "Suggest one possible cause of this systematic error": a sensible idea (e.g. zero error on the calipers) |
| State and explain, quantitatively | Give numbers: "R: 4 × 2% = 8%; L: 2%, so R contributes more" |
- Combining percentage uncertainties then finding the absolute uncertainty: the most common type in the whole chapter. About 70 items in 2010–2025, in nearly every Paper 2 Question 1 since 2016, typically 3–5 marks.
- Precision vs accuracy: about 25 items (definitions in Paper 2, data sets in Paper 1).
- Systematic vs random (causes, effect of averaging, calibration graphs): about 30 items.
- Uncertainty of a sum/difference, zero errors: about 8 Paper 1 items.
| Common mistake | Do this instead |
|---|---|
| Forgetting to double / triple for squared / cubed terms | % × power, every time (the most repeated report comment) |
| Forgetting to halve for a square root (or ÷ 3 for a cube root) | Find the % of what is under the root, then × ½ (or × ⅓) |
| Treating given % uncertainties as absolute | Read the units: "± 5%" is already a percentage |
| Subtracting uncertainties for a quotient or difference | Always add |
| Multiplying by 3 instead of dividing (finding r from V) | r ∝ V1/3, so %r = %V ÷ 3 |
| Δ to 2+ s.f.; value not rounded to match | Δ to 1 s.f.; value to the same decimal place |
Worked examples
Example 1 · Powers in a formula, then value ± uncertainty (Paper 2, 4 marks)
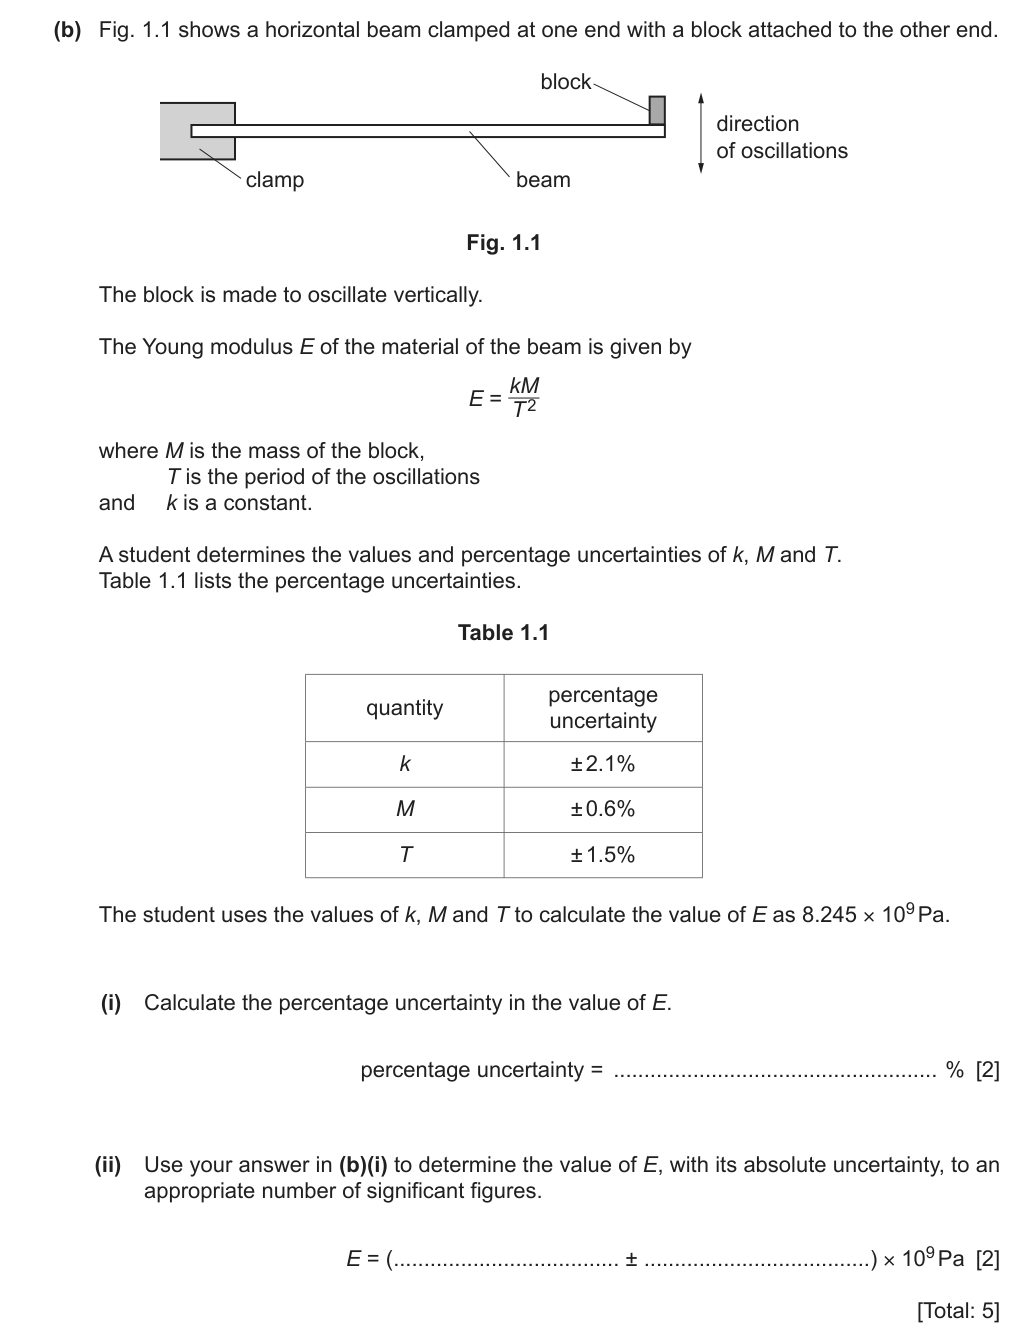
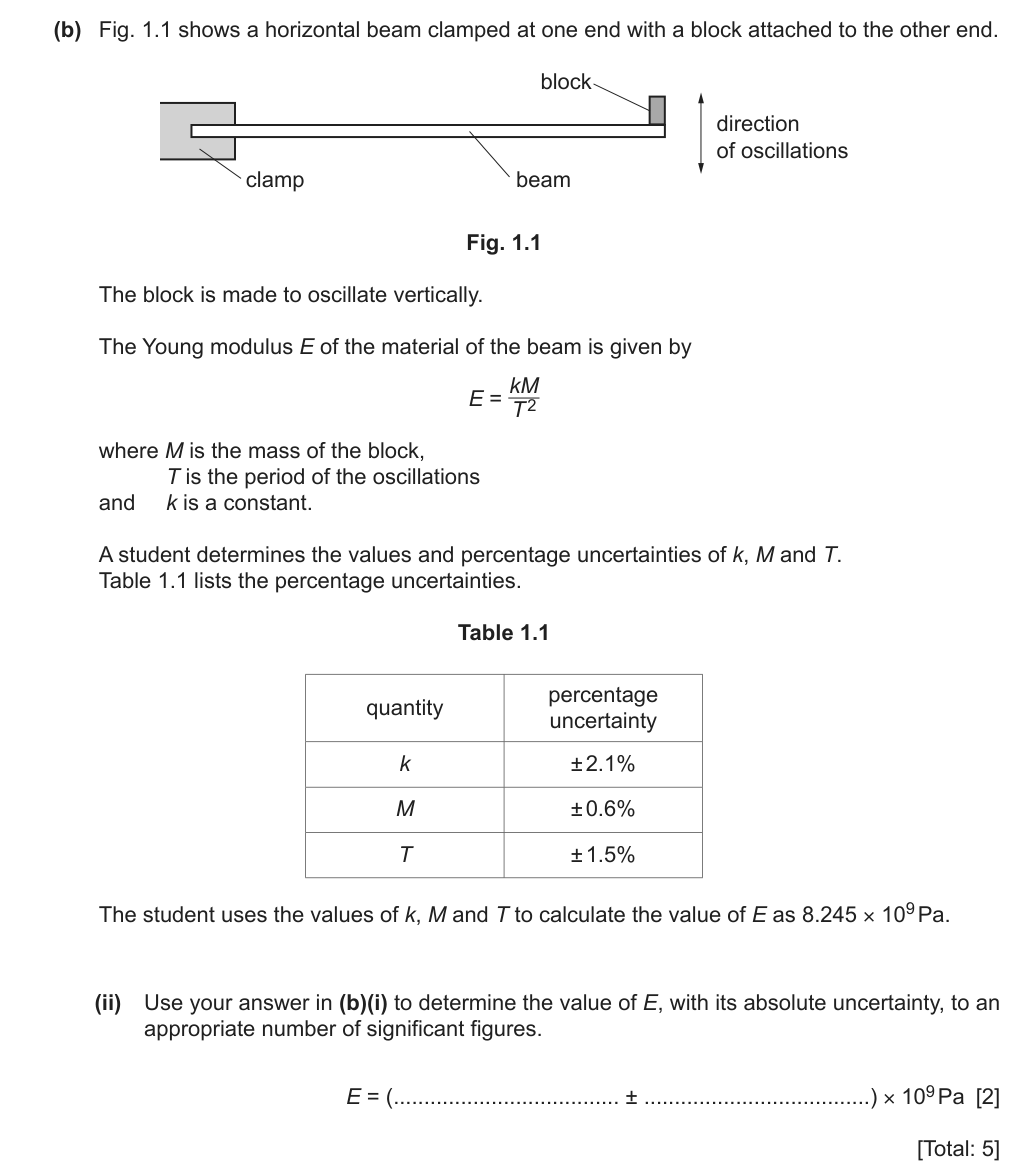
The Young modulus E is calculated from k, M and T, each with a percentage uncertainty. We combine them to get E's percentage uncertainty, then write E with its absolute uncertainty to a sensible number of figures.
- E = kM/T²products and quotients: percentages ADD; the power 2 doubles T's
- percentage uncertaintiesalready given as % - no converting needed
- with its absolute uncertaintyturn the % back into ± in pascals
- appropriate number of significant figuresuncertainty to 1 s.f.; E rounded to the same decimal place
- (i)% uncertainty in E
- (ii)E ± ΔE, properly rounded
- %k = 2.1%
- %M = 0.6%
- %T = 1.5%T is squared
- E = 8.245 × 10⁹ Pacalculated
- (i) Find%E
- Use%k + %M + 2 × %T
- TrapT is on the bottom but its % still ADDS - and doubles
- Use%k + %M + 2 × %T
- (ii) FindE ± ΔE
- Step 1ΔE = %E × E
- Needs%E from (i)
- Step 2ΔE to 1 s.f., then E to the same place
- Step 1ΔE = %E × E
T is on the bottom of the fraction. Do we subtract its percentage?
No - percentages always add for multiplying AND dividing. Uncertainties can only make things less certain.
Why is E written as 8.2, not 8.245?
The uncertainty is ± 0.5 (× 10⁹). Digits beyond the first decimal place are meaningless when the value could be 0.5 out.
5 Now solve it have a go on paper first, then open the worked solution
- %E = 2.1 + 0.6 + (2 × 1.5). C1
- = 5.7%. A1 The June 2022 report: "Some candidates forgot to double the percentage uncertainty of T."
- ΔE = (5.7 / 100) × 8.245 × 10⁹ = 4.7 × 10⁸ Pa (= 0.47 × 10⁹ Pa). C1
- Round Δ to 1 s.f. (0.5 × 10⁹), then E to the same decimal place: E = (8.2 ± 0.5) × 10⁹ Pa. A1 Only the strongest candidates wrote E to match the uncertainty (examiner report).
(i) %E = 2.1 + 0.6 + 2(1.5) = 5.7% (ii) ΔE = 0.057 × 8.245 × 10⁹ = 0.47 × 10⁹ → E = (8.2 ± 0.5) × 10⁹ Pa
5.7% of 8 is about 0.5, so the "± 0.5" looks right.
Example 2 · A cube root (Paper 2, 4 marks)
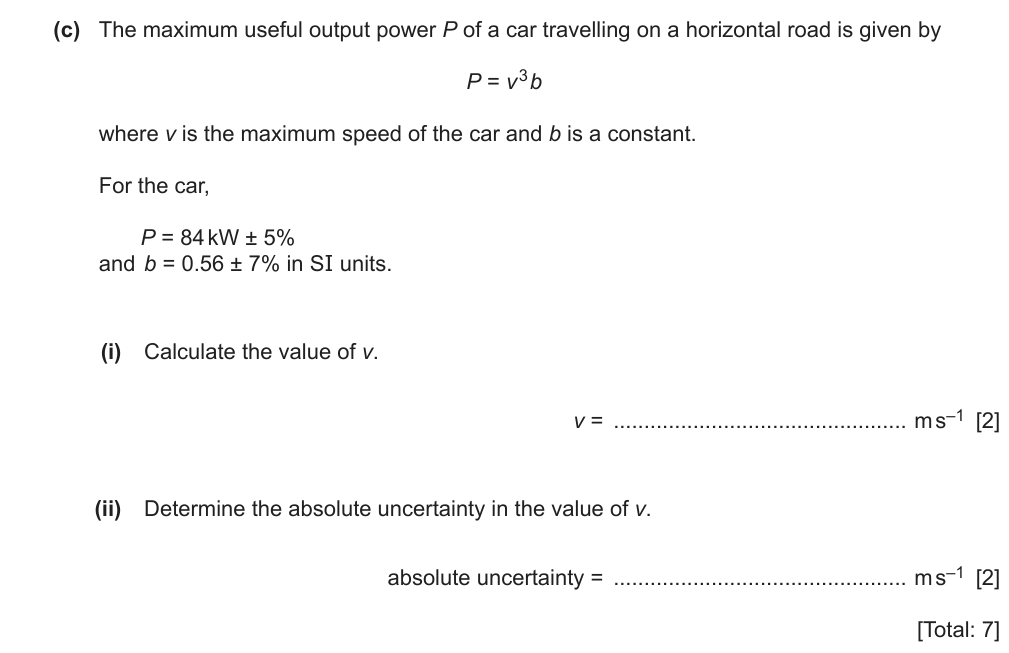
A car's power is P = v³b. We know P and b (each with a % uncertainty) and want the speed v, then how uncertain v is.
- 84 kWconvert to W first: 84 × 10³
- ± 5%, ± 7%percentages - they add when P and b are combined
- v³v = (P/b)1/3: the cube root DIVIDES the percentage by 3
- absolute uncertaintyturn %v back into ± m s−1
- (i)v
- (ii)absolute uncertainty in v
- P = 84 kW = 84 000 W ± 5%
- b = 0.56 ± 7%SI units
- (i) Findv
- Usev = (P ÷ b)1/3
- UnitskW → W
- Usev = (P ÷ b)1/3
- (ii) FindΔv
- Step 1%v = (%P + %b) ÷ 3
- Step 2Δv = %v × v
- Needsv from (i)
Why divide by 3?
v is a cube root. A power of 1/3 multiplies the percentage uncertainty by 1/3.
Do we divide each percentage by 3 before adding, or add first?
Either gives the same here, but think of it as: the whole of P/b (5% + 7%) is under the cube root, then ÷ 3.
5 Now solve it have a go on paper first, then open the worked solution
- (i) \(84 \times 10^{3} = v^3 \times 0.56\). C1 kW → W first. The report: "The most common error was not converting the power units from kW to W."
- \(v = (84\,000 / 0.56)^{1/3} = (150\,000)^{1/3} = 53\ \text{m s}^{-1}\). A1
- (ii) %v = (5% + 7%) / 3 = 4%. C1 Add first, then divide by 3: the whole of P/b is under the cube root.
- Δv = 0.04 × 53 = 2.1 → ± 2 m s⁻¹. A1
v = (84 000 / 0.56)1/3 = 53 m s⁻¹ %v = (5 + 7)/3 = 4% → Δv = 0.04 × 53 = 2 m s⁻¹
Fractional uncertainties: (0.05 + 0.07) / 3 = 0.04, then Δv = 0.04 × 53. Same marks.
4% of 53 is about 2, so v = (53 ± 2) m s−1. 53 m s−1 ≈ 190 km h−1 - a believable top speed for a car.
Example 3 · Precise, not accurate, and a square root (Paper 2, 5 marks)
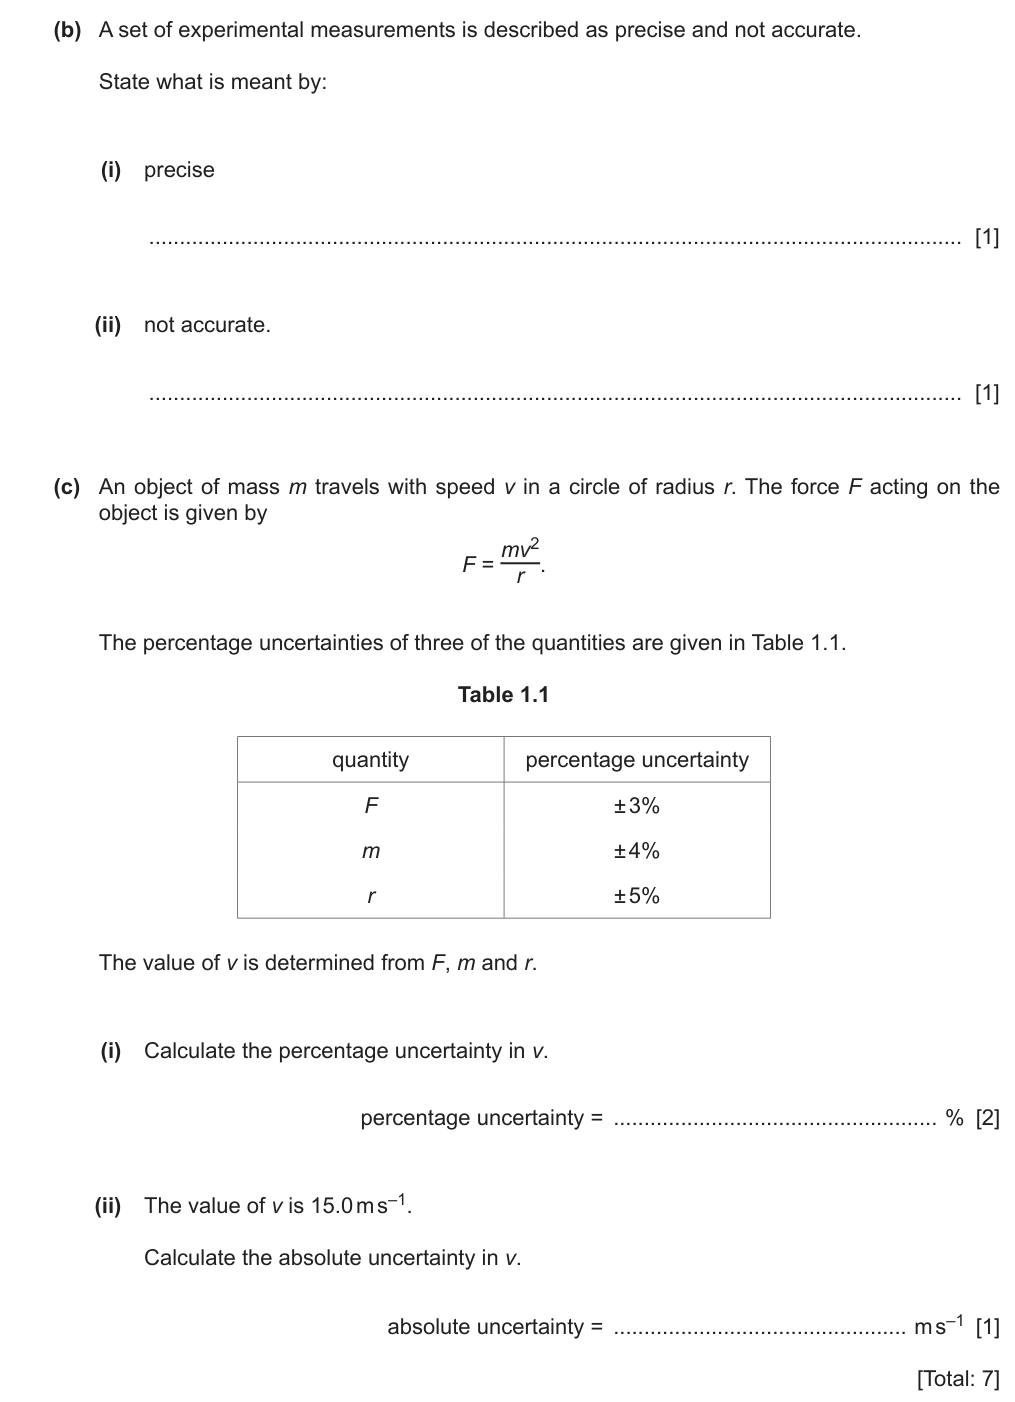
Part (b): explain what 'precise but not accurate' means. Part (c): v is found from F = mv²/r. We know the % uncertainties of F, m and r, and want v's - with the square root halving it.
- precisereadings close together: a small spread
- not accuratetheir average is far from the true value
- v is determined from F, m and rrearrange first: v² = Fr ÷ m
- v²square root at the end: halve the total %
- (b)meaning of precise and of not accurate
- (c)(i)% uncertainty in v
- (c)(ii)absolute uncertainty in v
- %F = 3%
- %m = 4%
- %r = 5%
- v = 15.0 m s−1for (c)(ii)
- (c)(i) Find%v
- Usev² = Fr/m → %v = ½(%F + %r + %m)
- Trap%m adds even though m is on the bottom
- Usev² = Fr/m → %v = ½(%F + %r + %m)
- (c)(ii) FindΔv
- Use%v × 15.0
Can a set of readings be precise but wrong?
Yes - if they all cluster tightly around the wrong value, e.g. because of a zero error. Precise is about spread; accurate is about closeness to the truth.
Why is the half applied to the whole sum?
We find v² first (adding all three %), then take the square root - which halves the percentage of v².
5 Now solve it have a go on paper first, then open the worked solution
- (b)(i) The measurements have a small range. B1
- (b)(ii) The (average of the) measurements is not close to the true value. B1
- (c)(i) \(v^2 = Fr/m\), so \(\%v = \tfrac12(\%F + \%r + \%m) = (3 + 5 + 4)/2\). C1 m is on the bottom but its % still adds. The November 2022 report: some candidates subtracted it.
- = 6%. A1
- (c)(ii) Δv = (6/100) × 15.0 = 0.9 m s⁻¹. A1
(b)(i) small range of measurements (ii) average not close to the true value (c)(i) (3 + 5 + 4)/2 = 6% (ii) 0.06 × 15.0 = 0.9 m s⁻¹
6% of 15.0 is 0.9 - so v = (15.0 ± 0.9) m s−1, a sensible spread.
Example 4 · A full question: accuracy, show that, uncertainty, overlap (Paper 2, 7 marks)
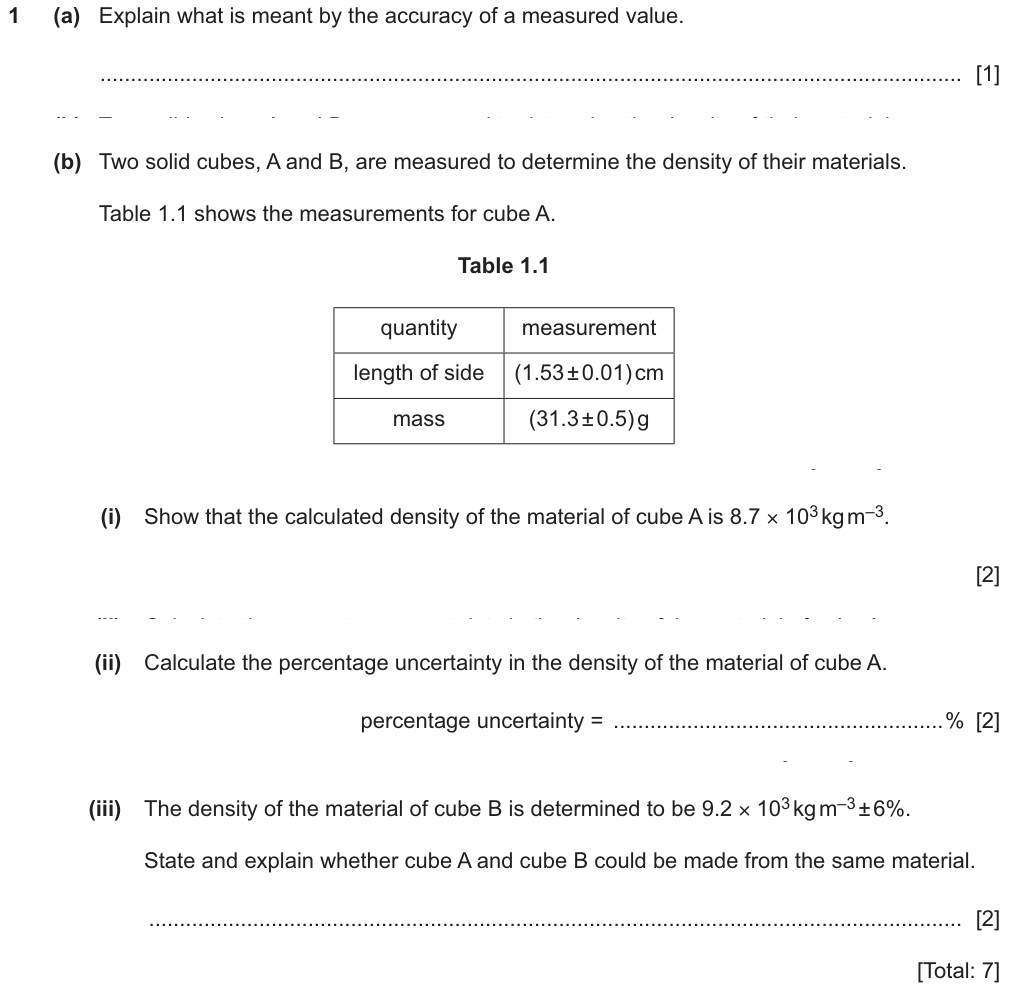
A cube's side and mass are measured with uncertainties. We calculate its density, the % uncertainty in that density, and then decide whether a second cube with a different measured density could be the same material.
- accuracyhow close the measured value is to the true value
- Show that … 8.7 × 10³substitute in SI units (g → kg, cm → m) and show the result
- side of a cubeV = l³: the side's % counts THREE times
- could be made from the same materialthe test is whether the two ranges OVERLAP
- (a)meaning of accuracy
- (b)(i)show ρ = 8.7 × 10³
- (b)(ii)% uncertainty in ρ
- (b)(iii)same material? with reason
- l = (1.53 ± 0.01) cmcube A
- m = (31.3 ± 0.5) gcube A
- ρB = 9.2 × 10³ ± 6%cube B
- (b)(i) Showρ
- Useρ = m ÷ l³
- Unitsg → kg (× 10−3), cm → m (× 10−2, then cubed)
- Useρ = m ÷ l³
- (b)(ii) Find%ρ
- Use%m + 3 × %l
- Each %0.5/31.3 and 0.01/1.53
- Use%m + 3 × %l
- (b)(iii) Decidesame material?
- Usewrite both as ranges and look for overlap
- Needs%ρ from (b)(ii)
- Trapdifferent uncertainties is NOT the test
- Usewrite both as ranges and look for overlap
Why does the side's uncertainty count three times?
Volume = l × l × l. Each factor brings its own 0.65%, so 3 × 0.65%.
Two densities, 8.7 and 9.2. Why might they still be the same material?
Each is only known within a range. If the ranges overlap, the true densities could be equal.
5 Now solve it have a go on paper first, then open the worked solution
- (a) How close the (measured) value is to the true value. A1
- (b)(i) \(\rho = m/V\). C1
- \(\rho = \dfrac{31.3 \times 10^{-3}}{(1.53 \times 10^{-2})^3} = 8.7 \times 10^{3}\ \text{kg m}^{-3}\). A1 "Show that": write the substitution in SI units. The March 2025 report: "a significant number made errors converting g into kg and cm into m".
- (b)(ii) (0.5/31.3) or (0.01/1.53) worked out; % = 1.6 + 3 × 0.65. C1
- = 3.6% ≈ 4%. A1
- (b)(iii) A: 8.7 × 10³ ± 4% → 8.35 to 9.05 × 10³. B: 9.2 × 10³ ± 6% → 8.65 to 9.75 × 10³. The ranges overlap. M1
- So they could be the same material. A1 The report: many said "no" because the uncertainties were different, which isn't the test. Overlap is.
(a) closeness of the measured value to the true value (b)(i) ρ = m/V = 31.3 × 10⁻³ / (1.53 × 10⁻²)³ = 8.7 × 10³ kg m⁻³ (ii) 1.6% + 3(0.65%) = 4% (iii) A's range 8.35–9.05 overlaps B's 8.65–9.75 (× 10³ kg m⁻³), so they could be the same material.
For (iii) the scheme also accepts "the density of A is within the range of the density of B" or "the difference in densities is within the uncertainty of B".
A's range (8.35-9.05) and B's (8.65-9.75) share 8.65-9.05 (× 10³ kg m−3), so 'could be the same' is justified. 8.7 × 10³ is about the density of brass or copper.
Example 5 · Errors on an analogue meter (Paper 2, 2 marks)
An analogue ammeter (a needle over a scale) measures a steady current. Give one cause of a random error and one of a systematic error.
- analoguea needle and a printed scale: parallax and reading between marks are possible
- random errorvaries from reading to reading - different each time
- systematic errorthe same offset on every reading
- 1.a cause of random error
- 2.a cause of systematic error
- constant currentthe true value isn't changing
- analogue ammeter
- 1. Randomcause
- Askwhat could change between readings? → the angle you view the needle from
- 2. Systematiccause
- Askwhat is wrong the same way every time? → needle not on zero
The current is constant. Why would the readings vary at all?
Because of the person reading it: looking from slightly different angles (parallax) or judging between scale marks differently.
Would taking more readings fix a zero error?
No. A zero error shifts every reading by the same amount, so averaging leaves it there.
5 Now solve it have a go on paper first, then open the worked solution
- Random: reading the scale from different angles (or wrongly interpolating between scale divisions). B1 Analogue meter means a needle against a scale: parallax and interpolation.
- Systematic: zero error (or a wrongly calibrated scale). B1 The needle doesn't sit on zero with no current, so every reading is off by the same amount.
1. reading the scale from different angles 2. zero error on the ammeter
Each answer is a CAUSE that fits a needle meter. 'Human error' or 'faulty meter' alone is too vague to score.
Summary
- Systematic = same shift every time, so accuracy suffers and averaging doesn't help (zero error, calibration). Random = scatter, so precision suffers and averaging helps (parallax, interpolation).
- Accurate = close to the true value. Precise = small range.
- + and −: absolute uncertainties add. × and ÷: % uncertainties add. Powers multiply the %, roots divide it. Never subtract.
- Report Δ to 1 s.f. and the value to the same decimal place.
| If you see… | Do this |
|---|---|
| A formula with powers, roots, constants | %y = Σ |power| × %quantity; ignore π, 2, ½ |
| "± 3%" given in a table | It's already a percentage: don't divide by the value |
| Extension, temperature rise, difference in diameters | Add the absolute uncertainties of both readings |
| "to an appropriate number of significant figures" | Δ 1 s.f.; value to the same decimal place; same ×10ⁿ |
| "Could they be the same?" | Find both ranges; overlap → yes |
| "How could random error be reduced?" | Repeat and average, at different places/orientations |
Can I do this?
- I can define systematic and random errors and give a real cause of each.
- I know averaging reduces random error but not systematic error.
- I can correct for a zero error, including a negative one.
- I can define accuracy (close to the true value) and precision (small range).
- I can say whether a data set is precise and/or accurate.
- I can convert between absolute, fractional and percentage uncertainty.
- I can combine uncertainties for sums, products, powers and roots.
- I add absolute uncertainties for a difference, and never subtract uncertainties.
- I write the final answer with Δ to 1 s.f. and the value to the same decimal place.
- I can explain quantitatively which measurement contributes most.
- I can decide whether two results agree using overlapping ranges.
- I avoid "human error" and give a specific cause.
Quiz
The multiple-choice and guided questions need JavaScript. The concept checks and exam practice below work without it.
Concept checks
A micrometer and vernier calipers both measure a 3.2 mm plate. The micrometer reads to 0.01 mm, the calipers to 0.1 mm. Which statement must be true: "more accurate" or "more precise"?
The micrometer gives the more precise measurement (its readings can agree to 0.01 mm). We can't say it is more accurate: it might have a zero error. 9702/13/O/N/17 Q4, answer B.
Why can't you reduce a zero error by taking more readings?
Every reading includes the same offset, so the average includes it too. You must find the zero reading and subtract it (or reset the instrument).
Why is the percentage uncertainty in \(r^3\) three times that in \(r\)?
\(r^3 = r \times r \times r\): a product of three quantities, each with the same %. Percentages add for a product, so 3 × %r.
A radius is found from a measured volume, \(r = (3V/4\pi)^{1/3}\). V is ± 1.8%. What is %r, and what mistake did many candidates make?
%r = 1.8 / 3 = 0.6%. The November 2023 report: "A common mistake was to multiply by 3 instead of dividing by 3." (9702/21/O/N/23 Q1(b)(ii))
Exam-style practice
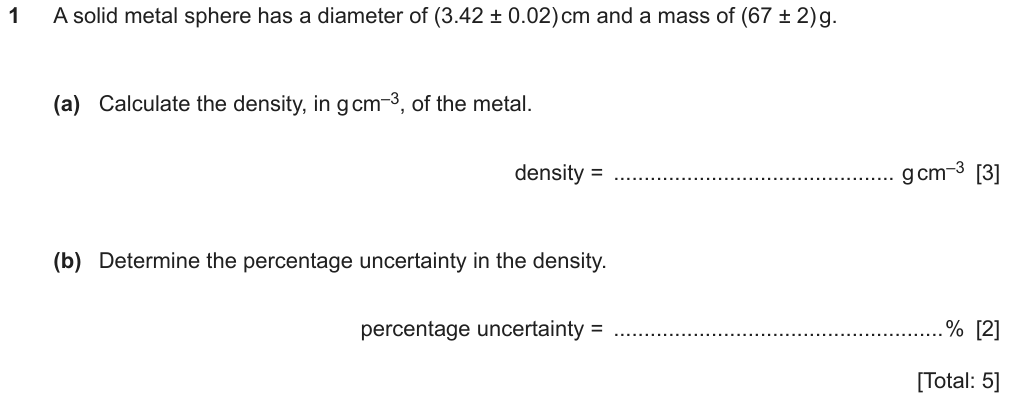
Answers and mark scheme
- (a) ρ = m/V C1; V = (4/3)π(3.42/2)³ = 20.9 cm³ C1; ρ = 67 / 20.9 = 3.2 g cm⁻³ A1
- (b) %ρ = %m + 3 × %d = (2/67 × 100) + 3 × (0.02/3.42 × 100) C1 = 3.0% + 1.75% = 4.7% (or 5%) A1
The June 2022 report: "Some candidates did not multiply the percentage error in the diameter by a factor of three", and others confused diameter with radius in the volume.
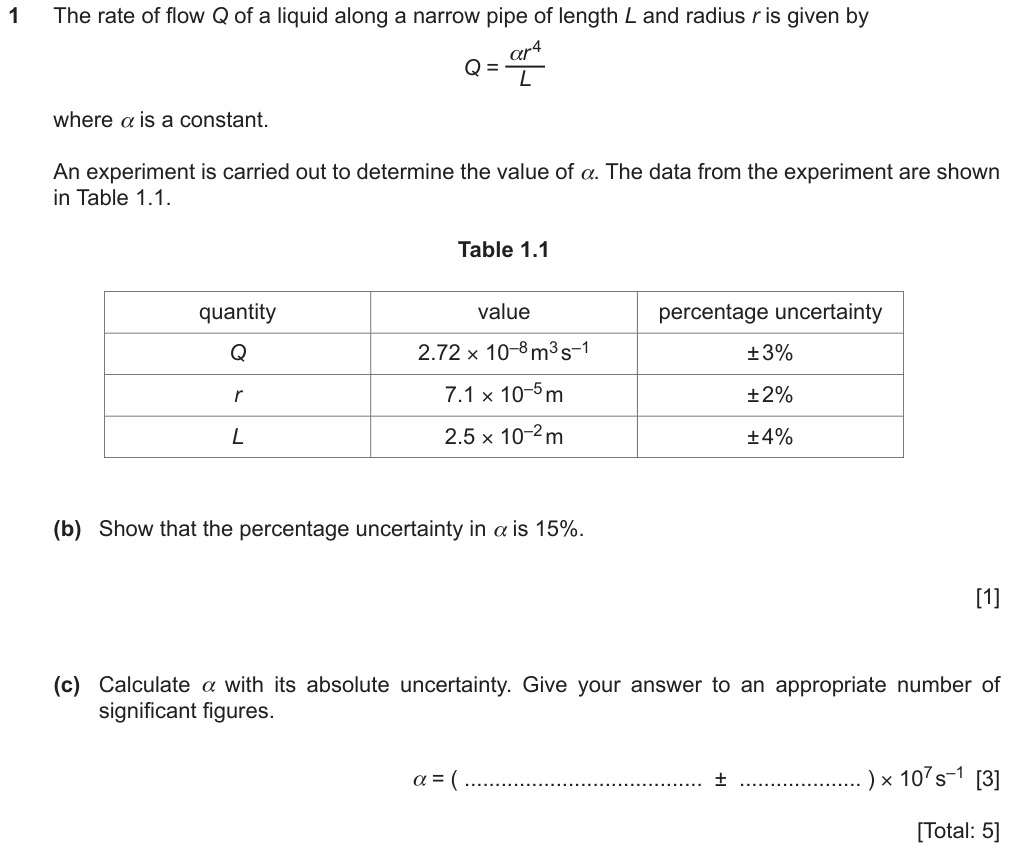
Answers and mark scheme
- (b) 3 + 4 + (4 × 2) = 15% A1. "Show": the 4 × 2 must be visible (November 2022 report).
- (c) α = QL/r⁴ = 2.72 × 10⁻⁸ × 2.5 × 10⁻² / (7.1 × 10⁻⁵)⁴ = 2.7 × 10⁷ C1; Δα = 0.15 × 2.7 × 10⁷ = 0.4 × 10⁷ C1; α = (2.7 ± 0.4) × 10⁷ s⁻¹ A1
Your progress on this note is saved when JavaScript is on.