
Kinematics
Motion graphs: gradients and areas
What you need to be able to do
- 2.1.2Use graphs to represent distance, displacement, speed, velocity and acceleration.
- 2.1.3Find displacement from the area under a velocity–time graph.
- 2.1.4Find velocity from the gradient of a displacement–time graph.
- 2.1.5Find acceleration from the gradient of a velocity–time graph.
Before you start: Describing motion (the five quantities). Next: Equations of motion.
Three graphs, two rules
Every motion graph question uses just two ideas: the gradient of a graph is the rate of change of the quantity on the y-axis, and the area under a graph adds up (y-quantity × time).
| Graph | Gradient gives | Area under it gives |
|---|---|---|
| displacement–time (s–t) | velocity | (nothing useful) |
| distance–time | speed | (nothing useful) |
| velocity–time (v–t) | acceleration | displacement |
| acceleration–time (a–t) | (not needed) | change in velocity |
Reading a gradient
Gradient of a straight line
\[ \text{gradient} = \frac{\Delta y}{\Delta x} = \frac{y_2 - y_1}{x_2 - x_1} \]
On a v–t graph: \(a = \dfrac{v - u}{t}\). On an s–t graph: \(v = \dfrac{\Delta s}{\Delta t}\).
Gradient of a curve at a point
Draw the tangent at that point, then find the gradient of the tangent.
The gradient changes along a curve: a curving s–t graph means the velocity is changing.
- Use a big triangle: at least half the length of the line (or tangent). The June 2018 report: too small a triangle made the value inaccurate.
- Read values off the axes, with their units, not numbers of squares. The November 2021 report: many candidates divided squares by squares (4/6 = 0.67) instead of 8 m s−1 / 6.0 s = 1.3 m s−2.
- Choose points where the line crosses grid lines, so they are easy to read exactly (November 2022 report).
- Keep the sign: a line sloping down has a negative gradient (deceleration on a v–t graph, moving backwards on an s–t graph).
Finding an area
Split the area under a v–t graph into rectangles, triangles and trapeziums:
Rectangle (constant v)
\[ s = v\,t \]
width × height
Triangle (from rest, or to rest)
\[ s = \tfrac12\, v\, t \]
½ × base × height
Trapezium (from u to v)
\[ s = \tfrac12 (u + v)\, t \]
average of the two sides × width
Graph shapes to recognise
| Motion | s–t graph | v–t graph | a–t graph |
|---|---|---|---|
| at rest | horizontal line | on the axis (v = 0) | on the axis |
| constant velocity | straight sloping line | horizontal line | on the axis (a = 0) |
| constant acceleration from rest | curve getting steeper | straight line through the origin | horizontal line above the axis |
| slowing down steadily | curve flattening off | straight line sloping down | horizontal line below the axis |
| thrown up, comes back down (up = +) | upside-down parabola | one straight line from +u through 0 to −v | horizontal at −g the whole time |
| moving back and forth at a steady speed | zigzag of straight lines | jumps between +v and −v | zero, with spikes at each turn |
Sketching a graph for marks
- Start and end in the right place: e.g. a ball thrown up starts at a positive velocity and ends at a negative one.
- Use a ruler for straight lines; only draw a curve when the gradient really changes (the June 2022 and November 2018 reports both mention freehand "straight" lines).
- Draw over the whole time range asked for, not just to the top of the flight.
- Velocity–time, not speed–time: velocity goes negative when the direction reverses.
- Label each line if there is more than one.
Try it: the three graphs together
s–t, v–t and a–t together
Teaching point: the gradient of each graph is the height of the one below it, and the area under v–t is the displacement. Move the time slider and watch all three.
Turn on JavaScript to switch between five motions and move the time cursor.
Mark-scheme focus
What the area and the gradient of a v–t graph represent

Area under v–t: "displacement" A1. Gradient of v–t: "acceleration" B1 9702/22/M/J/22 Q3(d).
- area = "acceleration"
- gradient = "displacement" (the most common wrong answer in 2022)
- acceleration = "velocity ÷ time" read from a single point
Area = height × width = (m s⁻¹) × s = m, a displacement. Gradient = rise ÷ run = (m s⁻¹) ÷ s = m s⁻², an acceleration. One point gives v/t, not Δv/Δt.
In that question "the distance travelled by trolley B" was also correct: B moved in one direction only, so distance = displacement (November 2023 report).
From: 9702/21/O/N/23 Q3(a), 9702/22/M/J/22 Q3(d) and their examiner reports.
Sketching the v–t graph of a ball thrown up
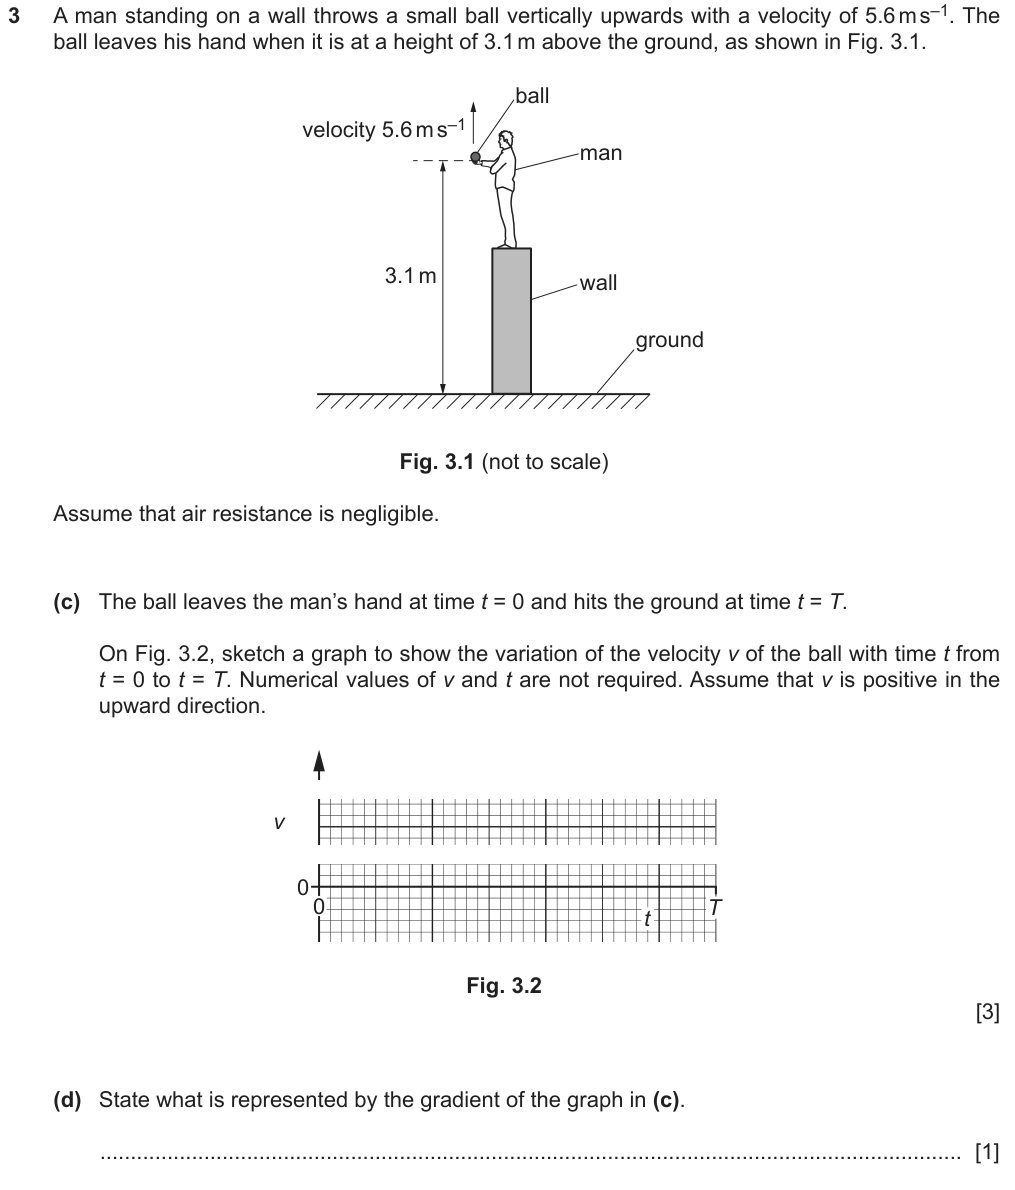
- line from a non-zero speed at t = 0 to a greater speed at t = T
- a single sloping straight line from t = 0 to t = T
- starts positive, ends negative
- final speed = initial speed (the ball lands below the hand, so it falls further)
- a curve
- stopping the line at the top of the flight
- a V shape (that is speed, not velocity)
The acceleration is −g all the time, so the gradient is constant: one straight line. It falls 4.7 m but rose only 1.6 m, so it ends faster than it started.
The line crosses zero at the top of the flight, where v = 0 but a is still −9.81 m s⁻².
From: 9702/22/M/J/22 Q3(c)–(d) and the June 2022 examiner report.
- Gradient and area of a v–t graph: the most common Paper 2 kinematics task (2 marks each, C1 A1).
- Area below the axis (displacement vs distance): Paper 2 and about one Paper 1 question a year.
- Pick the right graph (s–t ↔ v–t ↔ a–t, distance vs displacement): Paper 1, most sessions.
- Sketch a graph: Paper 2, 2–3 marks, one mark per feature.
Worked examples
Example 1 · A v–t graph that crosses the axis (Paper 2, 6 marks) ★★★ Hard
Why it is hard: the November 2023 report says many candidates did not compare the gradients, read it as an acceleration–time graph, or did not realise the part below the axis is negative displacement.
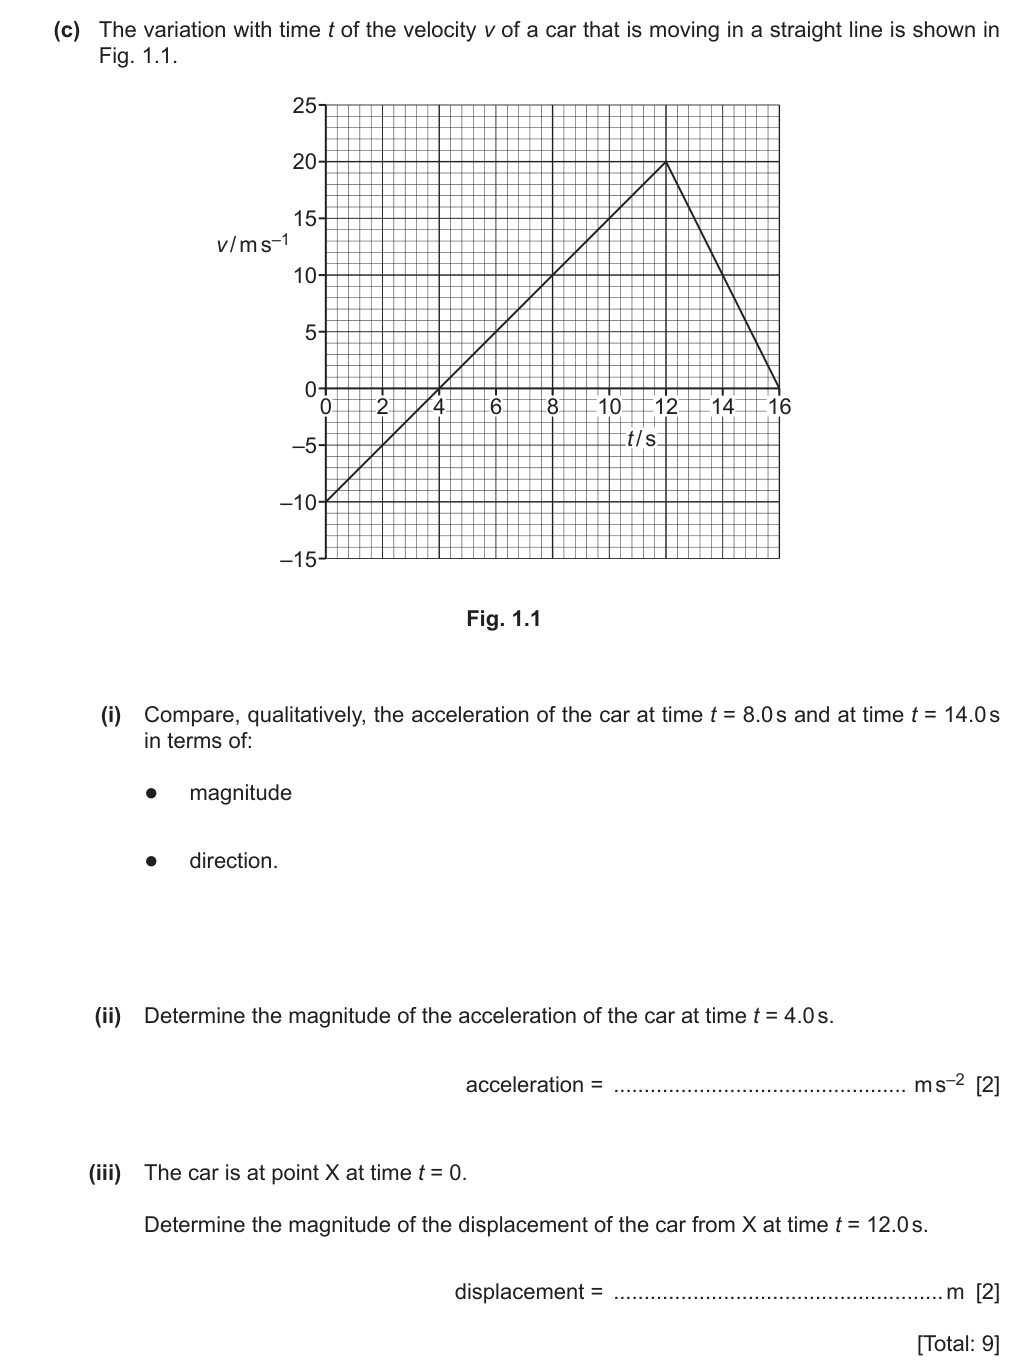
A car's velocity graph starts BELOW the axis (−10 m s−1: moving backwards), rises steadily through zero to +20 m s−1 at 12 s, then falls to zero at 16 s. We compare accelerations, find one, and find how far the car is from X.
- velocity-time graphgradient = acceleration; area = displacement
- Compare … magnitude and directiontwo statements: which is bigger, and same or opposite way
- −10negative velocity = moving the other way; area below the axis is backwards displacement
- magnitude of the displacement from Xareas above minus areas below
- (i)compare a at 8.0 s and 14.0 s
- (ii)a at 4.0 s
- (iii)displacement from X at 12.0 s
- v = −10 m s−1t = 0
- v = 0t = 4 s
- v = 20 m s−1t = 12 s
- v = 0t = 16 s
- (i) Comparea at 8 s and 14 s
- Usecompare gradients: 30 ÷ 12 vs −20 ÷ 4
- (ii) Finda at 4 s
- Usegradient of the first straight line
- TrapΔv = 20 − (−10) = 30, not 10
- Usegradient of the first straight line
- (iii) Finddisplacement at 12 s
- Usearea above − area below
- Below (0-4 s)½ × 4 × 10 backwards
- Above (4-12 s)½ × 8 × 20 forwards
- Usearea above − area below
Where does the car change direction?
At t = 4 s, where the line crosses the axis: before that it moves backwards, after it moves forwards.
Why do we subtract the area below the axis?
It is displacement in the opposite direction - it takes the car back towards (and past) X.
5 Now solve it have a go on paper first, then open the worked solution
- (i) Acceleration = gradient. From 0 to 12 s the line rises 30 m s⁻¹ in 12 s; from 12 to 16 s it falls 20 m s⁻¹ in 4 s. So at 14 s the gradient is steeper and negative. Magnitude at 8.0 s is less than at 14.0 s B1; the directions are opposite B1
- (ii) \(a = \dfrac{\Delta v}{\Delta t} = \dfrac{20 - (-10)}{12 - 0}\) C1 = 2.5 m s−2 A1 Any two points on the same straight line give 2.5. Mind the −10: 20 + 10 = 30.
- (iii) From 0 to 4 s the velocity is negative: area = ½ × 4 × 10 = 20 m backwards. From 4 to 12 s: area = ½ × 8 × 20 = 80 m forwards. Displacement = 80 − 20 C1 = 60 m A1
(i) magnitude at 8.0 s smaller than at 14.0 s; opposite directions (ii) a = (20 + 10)/12 = 2.5 m s⁻² (iii) ½ × 8 × 20 − ½ × 4 × 10 = 60 m
By equation, the scheme also accepts \(s = ut + \tfrac12at^2 = (-10)(12) + \tfrac12(2.5)(12^2) = -120 + 180 = 60\) m. The distance travelled would be 80 + 20 = 100 m.
60 m is less than the forward 80 m because the car first went 20 m backwards. The steeper line at 14 s fits a bigger deceleration.
Example 2 · Gradient and a trapezium (Paper 2, 4 marks) ★★ Medium
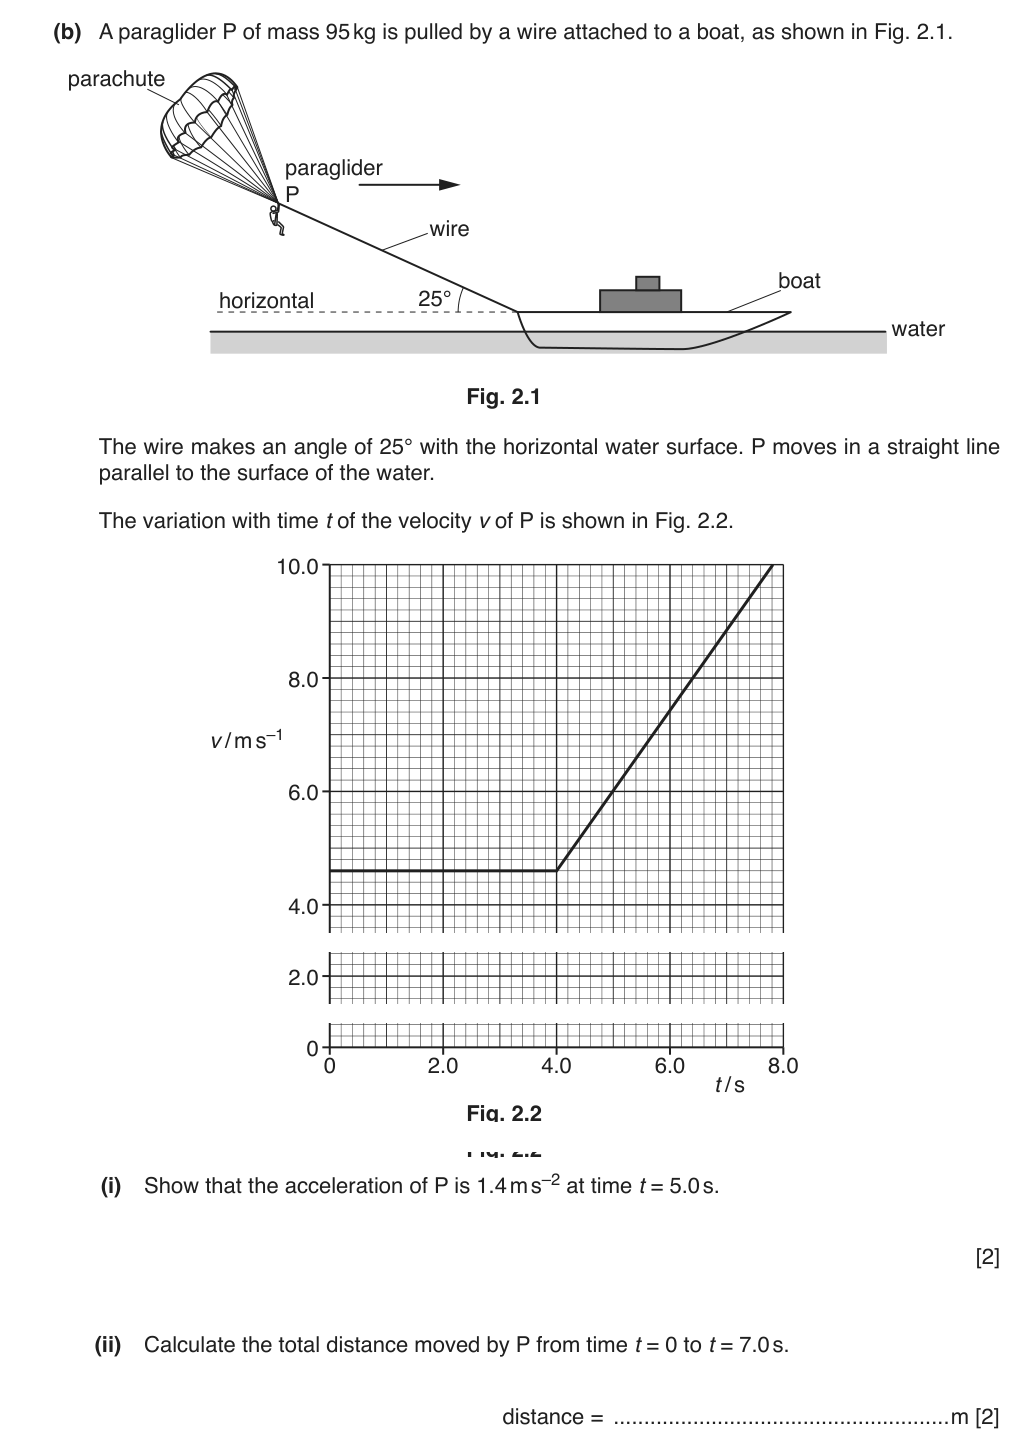
A paraglider moves at a steady 4.6 m s−1 for 4 s, then speeds up steadily. We find its acceleration from the sloping part and the distance from the area under the graph up to 7.0 s.
- Show that … 1.4write the readings and the division, then the value
- total distance … to t = 7.0 sarea under the graph, stopping at 7.0 s - not the end of the graph
- straight lineconstant acceleration: the gradient is the same everywhere on it
- (i)show a = 1.4 at 5.0 s
- (ii)distance from 0 to 7.0 s
- 4.6 m s−10 to 4.0 s
- 8.8 m s−1read at 7.0 s
- (i) Showa = 1.4
- Usegradient of the sloping line: (8.8 − 4.6) ÷ (7.0 − 4.0)
- (ii) Finddistance
- Usearea = rectangle + trapezium
- 0-4 s4.6 × 4.0
- 4-7 s½(4.6 + 8.8) × 3.0
- Trap4-7 s is a trapezium, not a triangle - v doesn't start at zero
- Usearea = rectangle + trapezium
At t = 5.0 s, can we use any two points on the sloping line?
Yes - it's a straight line, so its gradient is the same everywhere. Pick far-apart points that are easy to read.
Why split the area at 4.0 s?
The shape changes there: a rectangle before, a trapezium after.
5 Now solve it have a go on paper first, then open the worked solution
- (i) Acceleration = gradient of the sloping part: \(a = \dfrac{8.8 - 4.6}{7.0 - 4.0}\) C1 = 1.4 m s−2 A1 A "show that": write the substitution, then the value. Read v at t = 7.0 s as 8.8 m s⁻¹ from the graph.
- (ii) Split the area at t = 4.0 s. Rectangle: 4.6 × 4.0 = 18.4 m.
- Trapezium from 4.0 s to 7.0 s: ½ × (4.6 + 8.8) × 3.0 = 20.1 m. C1
- Total = 18.4 + 20.1 = 39 m (38.5) A1
The June 2017 report: some candidates used the whole area under the graph (to 8 s, not 7 s), or a triangle for 4.0–7.0 s. The line does not start at zero there, so it is a trapezium.
39 m over 7 s is an average of 5.6 m s−1, between 4.6 and 8.8 - sensible.
Example 3 · Up the slope and back: displacement, not distance (Paper 2, 6 marks) ★★★ Hard
Why it is hard: the June 2018 report says a common error was to add the up-slope and down-slope distances, and some used one equation of motion for the whole 24 s although the acceleration changes at 12 s.
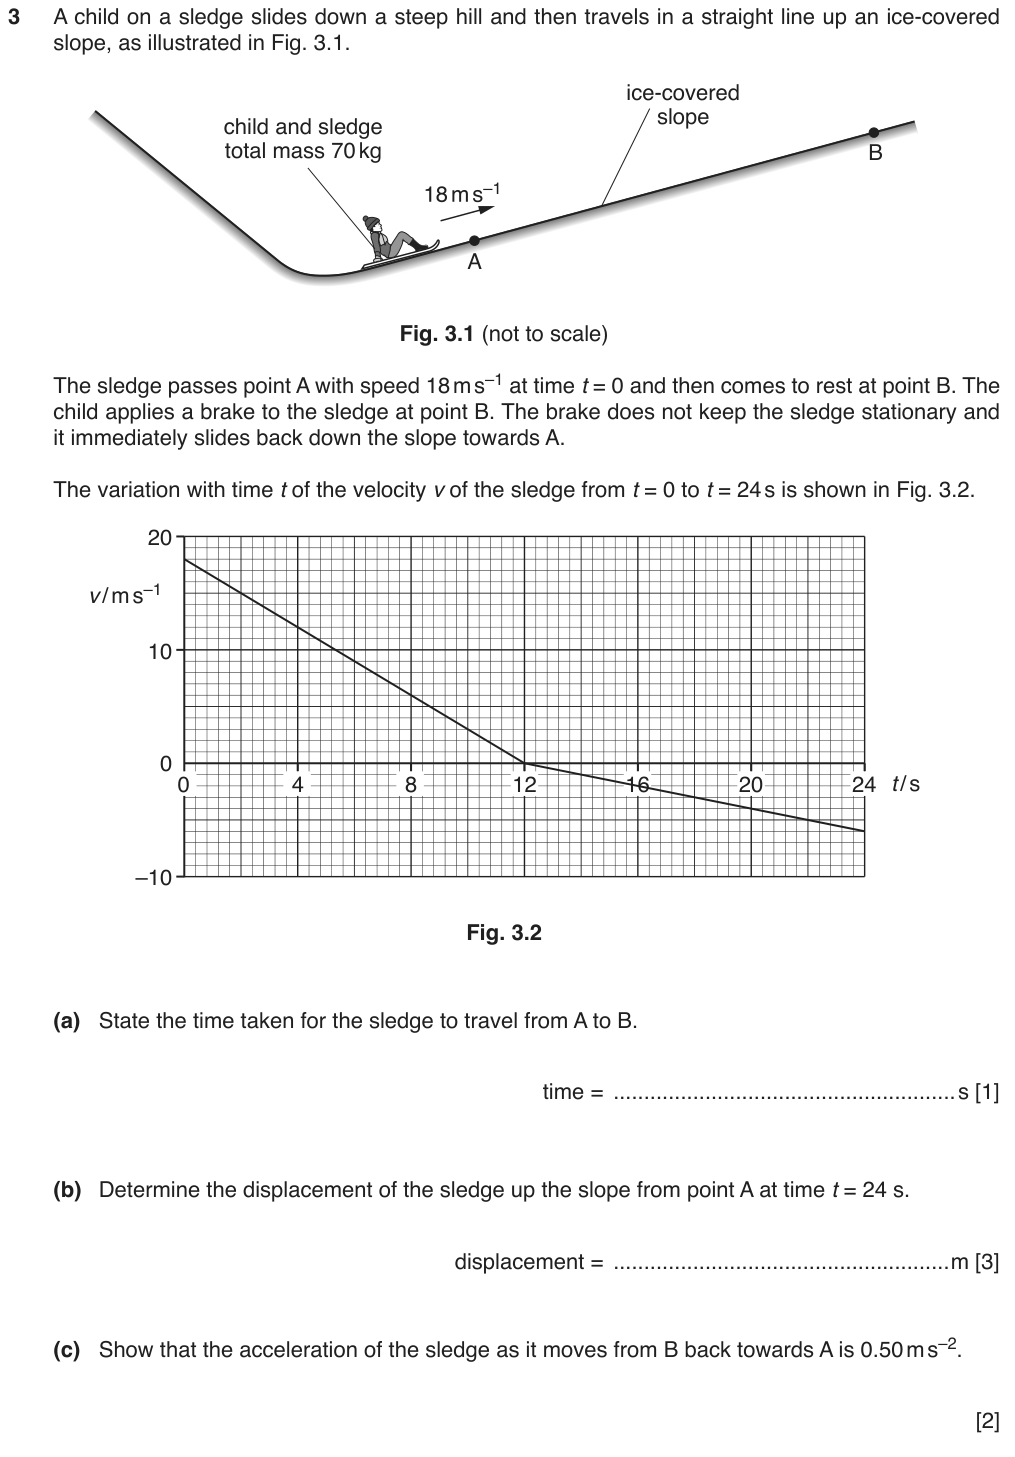
A sledge slides up an icy slope, slows to a stop at B after 12 s, then slides back down. The graph goes from +18 to 0, then below the axis to −6. We need the time to B, where it is after 24 s, and its acceleration coming back.
- comes to rest at Bv = 0: where the graph crosses the axis
- displacement … up the slope from Aarea up the slope MINUS area back down
- Show that … 0.50gradient of the part from 12 s to 24 s
- (a)time from A to B
- (b)displacement from A at 24 s
- (c)show a = 0.50 coming back
- 18 m s−1t = 0, up the slope
- 0t = 12 s
- −6 m s−1t = 24 s, back down
- the acceleration changes at 12 s (friction flips direction), so one suvat for the whole 24 s is wrong
- (b) Finddisplacement at 24 s
- Usearea above − area below
- Up½ × 12 × 18
- Down½ × 12 × 6
- Trapadding gives distance, not displacement
- Usearea above − area below
- (c) Showa = 0.50
- Usegradient from 12 to 24 s: 6 ÷ 12
Why isn't the acceleration the same going up and coming down?
Friction always opposes motion. Going up it adds to the pull of gravity down the slope; coming down it subtracts. So the slopes differ.
After 24 s, is the sledge above or below A?
Above: it went 108 m up but only 36 m back down.
5 Now solve it have a go on paper first, then open the worked solution
- (a) The sledge stops at B when v = 0: t = 12 s A1
- (b) Up the slope (0–12 s, above the axis): ½ × 12 × 18 = 108 m C1
- Back down (12–24 s, below the axis): ½ × 12 × 6 = 36 m C1
- Displacement from A = 108 − 36 = 72 m up the slope A1 Subtract: the second part is backwards.
- (c) Gradient from 12 s to 24 s: \(a = \dfrac{6 - 0}{24 - 12}\) C1 = 0.50 m s−2 A1
For (c) the scheme accepts four routes: the gradient, \(v^2 = 2as\) with s = 36 m, \(s = \tfrac12at^2\), or \(s = vt - \tfrac12at^2\). They all give 0.50 m s⁻².
72 m up the slope: positive and less than 108 m, as it must be - it has come part of the way back.
Example 4 · Tangent on a curve, and the scale trap (Paper 1, 1 mark) ★★★ Hard
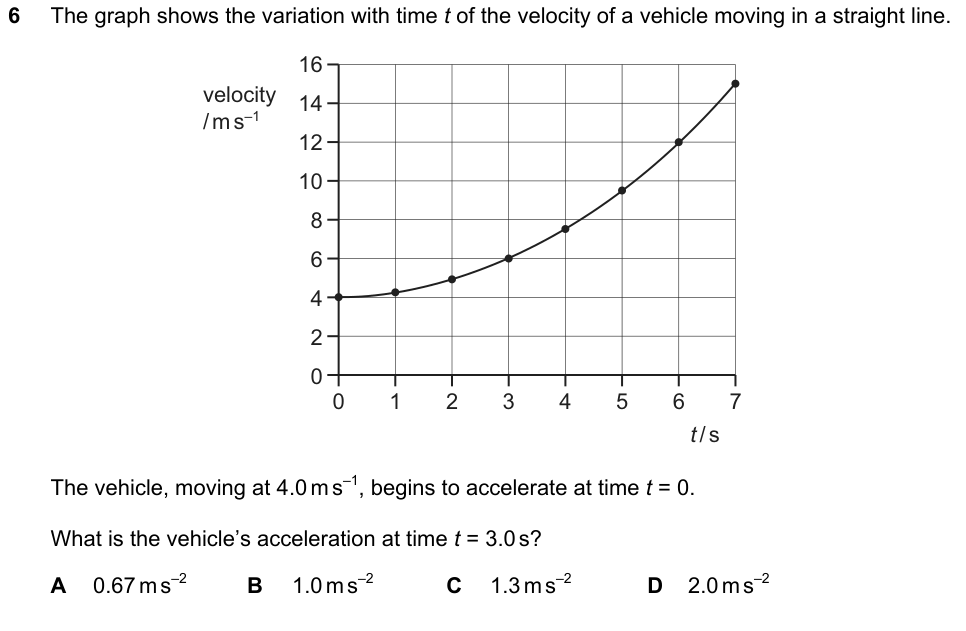
Why it is hard: the November 2021 report says many chose A. They knew to use the gradient at 3.0 s but read the scale as squares (4 squares ÷ 6 squares = 0.67).
A vehicle's speed rises along a curve. We need the acceleration at one instant, t = 3.0 s - the gradient of the curve right there.
- acceleration at t = 3.0 sinstantaneous: gradient of the TANGENT at 3.0 s
- velocity-time graphread gradients in the axis units (m s−1 per s), not in squares
- a at 3.0 s
- v ≈ 6.0 m s−1at 3.0 s
- axescheck each square's value on both axes
- Finda at 3.0 s
- Usegradient of the tangent
- Drawtangent at (3.0, 6.0), extended into a big triangle
- Trap4 squares ÷ 6 squares = 0.67 ignores the scales
- Usegradient of the tangent
Why not just use (15 − 4) ÷ 7?
That is the AVERAGE acceleration over 7 s. On a curve the gradient changes; we need it at 3.0 s only.
How can you check your tangent?
Look at points just either side of 3.0 s: from 2 s to 4 s, v goes 5.0 → 7.5, about 1.25 m s−2.
5 Now solve it have a go on paper first, then open the worked solution
- The graph is curved, so draw the tangent at t = 3.0 s (v = 6.0 m s−1).
- Extend it to make a big triangle: it passes about (0, 2.0) and (6.0, 10.0).
- Gradient = (10.0 − 2.0) m s−1 ÷ (6.0 − 0) s = 8.0 / 6.0 = 1.3 m s−2 → C 1
Check with the points either side: from 2 s to 4 s the velocity goes 5.0 → 7.5, i.e. 2.5 / 2 = 1.25 m s⁻². Close to 1.3, not 0.67 or 2.0.
Example 5 · From displacement–time to acceleration–time (Paper 1, 1 mark) ★★★ Hard
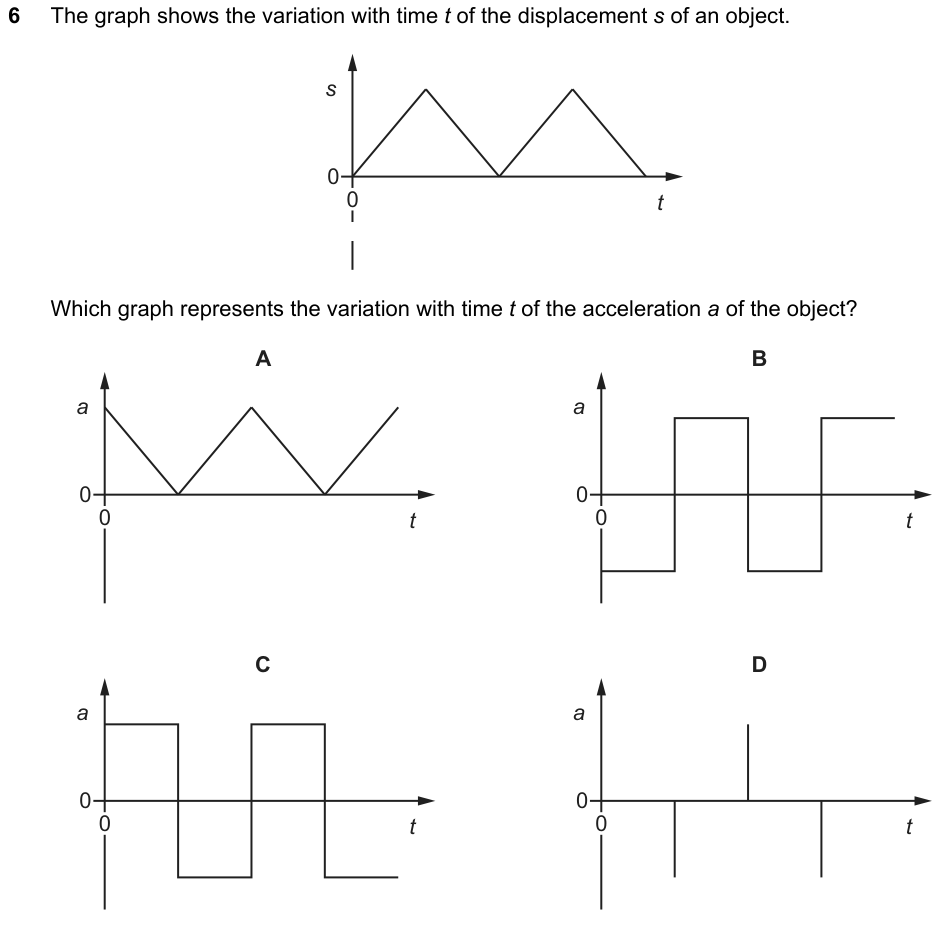
Why it is hard: the March 2023 report says many chose C. C is the velocity–time graph, one step too few.
A displacement-time graph made of straight zig-zags: the object goes forward at a steady rate, then back, then forward... We have to pick the matching ACCELERATION-time graph - two gradient steps away.
- displacement-timeits gradient is velocity
- accelerationthe gradient of velocity - so differentiate TWICE
- straight linesconstant velocity on each part
- the acceleration-time graph
- s-tstraight lines up and down
- Finda-t graph
- Step 1s-t gradient → v-t: constant +v, then constant −v
- Step 2v-t gradient → a-t: zero on each flat part, a spike at each sudden flip
- Trapthe square wave (C) is the VELOCITY graph - one step short
- Step 2v-t gradient → a-t: zero on each flat part, a spike at each sudden flip
- Step 1s-t gradient → v-t: constant +v, then constant −v
On a straight part of the s-t graph, what is the acceleration?
Zero - the velocity is constant there.
What happens at a corner of the s-t graph?
The velocity flips from +v to −v almost instantly. A big change in a tiny time is a large acceleration for a moment: a spike.
5 Now solve it have a go on paper first, then open the worked solution
- s–t is made of straight lines, so each part has a constant velocity: +v going up, −v coming down. (That is graph C.)
- Constant velocity means zero acceleration along each straight part.
- At each corner the velocity flips from +v to −v (or back) almost instantly: a large acceleration for a very short time, a spike. First turn: + to −, a negative spike; next turn: a positive spike → D 1
The answer must be zero almost everywhere, with spikes alternating in sign (+ to − needs a negative spike, − to + a positive one): D.
Summary
- Gradient of s–t = velocity. Gradient of v–t = acceleration. Area under v–t = displacement. Area under a–t = change in velocity.
- Curves: draw a tangent. Gradients: big triangle, values from the axes with units.
- Area below the time axis is negative displacement; distance adds both areas.
- Sketches: right start and end values, ruler for straight lines, the full time range, velocity can be negative.
| If you see… | do this |
|---|---|
| "acceleration at t = …" on a v–t graph | gradient there (tangent if curved) |
| "distance / displacement" from a v–t graph | area: split into shapes; subtract the parts below the axis for displacement |
| a straight line that does not start at v = 0 | trapezium ½(u + v)t, not a triangle |
| "which graph shows …" from another graph | gradient step by step: s–t → v–t → a–t |
Can I do this?
- I know what the gradient and the area of s–t, v–t and a–t graphs give.
- I can find a gradient with a big triangle, reading the axes (not squares), including a tangent on a curve.
- I can find the area under a v–t graph with rectangles, triangles and trapeziums.
- I subtract the area below the axis for displacement and add it for distance.
- I can recognise the graph shapes for rest, constant velocity, constant acceleration and an object thrown up.
- I can sketch a v–t graph that earns every mark.
Anything unticked: revise that section first. All ticked: take the quiz.
Quiz
Your progress on this note is saved when JavaScript is on.