
Practical skills: Paper 6 Alternative to Practical
Conclusions, errors and improvements
In this note
- AO3Write a conclusion that matches the results and quotes the data, not theory.
- AO3Decide whether two values are equal within the limits of experimental accuracy (within 10%), backed by a calculation.
- AO3Spot an anomalous result and say what to do with it.
- AO3Name a specific source of error (random, systematic, measurement) for THIS experiment.
- AO3Suggest an improvement that fixes that error, and say why it helps.
Before you start: graphs.
Rules to learn
Writing a conclusion
A conclusion says what the RESULTS show. It must agree with the data on the page - even if it is not what theory predicts - and it must name both variables.
General methodHow to write any conclusion
- Look at the table or graph: as the independent variable increases, what does the dependent variable do?
- Write one sentence with BOTH variables: "As the length of the wire increases, the current decreases."
- Add the pattern if there is one: "…at a decreasing rate", or "the graph is a straight line through the origin, so V is proportional to l".
- If asked to justify, quote numbers from the table: "from 0.40 A at 20 cm to 0.18 A at 100 cm".
Example Results: length 20, 40, 60, 80 cm; current 0.40, 0.29, 0.23, 0.19 A. Write a conclusion.
Both variables, direction, then the pattern.
- As the length increases, the current decreases.
- It falls by less each time (0.11, then 0.06, then 0.04 A): it decreases at a decreasing rate.
Answer As the length of wire increases, the current decreases, and it decreases more slowly at greater lengths.
Try it yourself
Show answer
Answer yes
Equal within the limits of experimental accuracy
No two measured values are ever exactly equal. Cambridge says two values can be treated as equal within the limits of experimental accuracy if they are within 10% of each other. Almost every paper has one of these, for 2 marks: one for the statement, one for the justification with a calculation.
General methodHow to answer 'Are the values equal within the limits of experimental accuracy?'
- Find the difference between the two values.
- Divide by one of them (use the larger, or the 'known' value if there is one) and × 100 to get a percentage.
- Compare with 10%.
- Write: "Yes / No, because the values differ by …%, which is less / more than 10%" - the statement must match your numbers.
Example A student gets k₁ = 25.0 N/m and k₂ = 23.6 N/m. Are they equal within the limits of experimental accuracy?
Percentage difference, compare with 10%.
- difference = 25.0 − 23.6 = 1.4 N/m
- \(\dfrac{1.4}{25.0}\times100=5.6\%\)
- 5.6% < 10%
Answer Yes: they differ by 5.6%, which is within 10%.
Example The focal length of a lens is labelled 15.0 cm. A student measures 12.9 cm. Does the result agree?
Within 10% of 15.0 cm means 13.5 cm to 16.5 cm.
- \(\dfrac{15.0-12.9}{15.0}\times100=14\%\)
- 14% > 10%
Answer No: 12.9 cm is 14% below 15.0 cm, more than 10%.
Try it yourself
Show answer
Answer 4.4%
Show answer
Answer yes (4.4% < 10%)
Show answer
Answer 36.0
Anomalous results
An anomaly is a result that does not fit the pattern of the others. On a graph it is the point well off the best-fit line; in a table it is the repeat far from the other repeats.
| Where | What to do |
|---|---|
| in a set of repeats | leave it out of the average (say so), or repeat that reading |
| on a graph | circle it, ignore it when drawing the best-fit line, and label it anomalous |
| in a planning answer | "repeat any anomalous readings" |
Why it happens: a misread scale, the timer started late, a reading written down wrong - one-off slips, not a fault in the whole experiment.
Sources of error
Every "suggest a source of error" question wants something that really happens in THAT experiment, even when it is done carefully. "Human error" and "the apparatus was not accurate" score nothing.
| Kind | What it is | Examples | Reduced by |
|---|---|---|---|
| random error | scatter: readings vary unpredictably either side of the true value | reaction time on a stopwatch; judging when an image is sharpest; reading a fluctuating meter | repeating and averaging; timing many oscillations |
| systematic error | every reading off by the same amount in the same direction | a zero error; a thermometer that reads 2 °C high; heat always lost to the room | correcting the zero; calibrating; insulating |
| measurement error | the reading differs from the true value | parallax; the precision of a ruler (±1 mm) | eye perpendicular; a more precise instrument |
| Experiment | A source of error the scheme accepts |
|---|---|
| Timing a pendulum / spring | reaction time at the start and stop; judging the end of a swing |
| Cooling / heating water | heat lost to the surroundings; the thermometer takes time to respond; temperature not even (not stirred) |
| Ray tracing with a ray box | the ray has a thickness, so it is hard to mark its centre / place the crosses exactly |
| Ray tracing with pins | difficult to line the pins up exactly; pins too close together |
| Lens and screen | difficult to judge exactly where the image is sharpest |
| Resistance wire | the wire heats up and its resistance changes; the contact point of the crocodile clip is not exact |
| Balancing a metre rule | hard to find the exact balance point; the mass's position is hard to read (the centre of the mass is not at its edge) |
Suggesting improvements
General methodHow to suggest any improvement
- Name the problem (the source of error) you are fixing.
- Say the change: a specific piece of apparatus or a specific step.
- Say why it helps, in this experiment.
| Problem | Improvement | Why it helps |
|---|---|---|
| reaction time on short timings | time more oscillations (e.g. 20 instead of 10) | the same reaction error is a smaller fraction of a longer time |
| heat lost from the water | insulate the beaker; put a lid on it; shield it from draughts | less energy lost to the surroundings |
| image hard to judge | darken the room / use a brighter object; move the screen slowly back and forth | the edge of a sharp image is easier to see |
| pins hard to line up | pins further apart (at least 5 cm); pins vertical; look at the bases of the pins | a small misplacement makes a smaller angle error |
| wire heats up | switch off between readings; use a smaller current | the temperature, and so the resistance, stays constant |
| too few readings / narrow range | take at least 5 readings over a wider range | a more reliable trend or graph |
| scatter in repeats | repeat each reading and take the average | reduces the effect of random errors |
From the past papers
Past paper 1
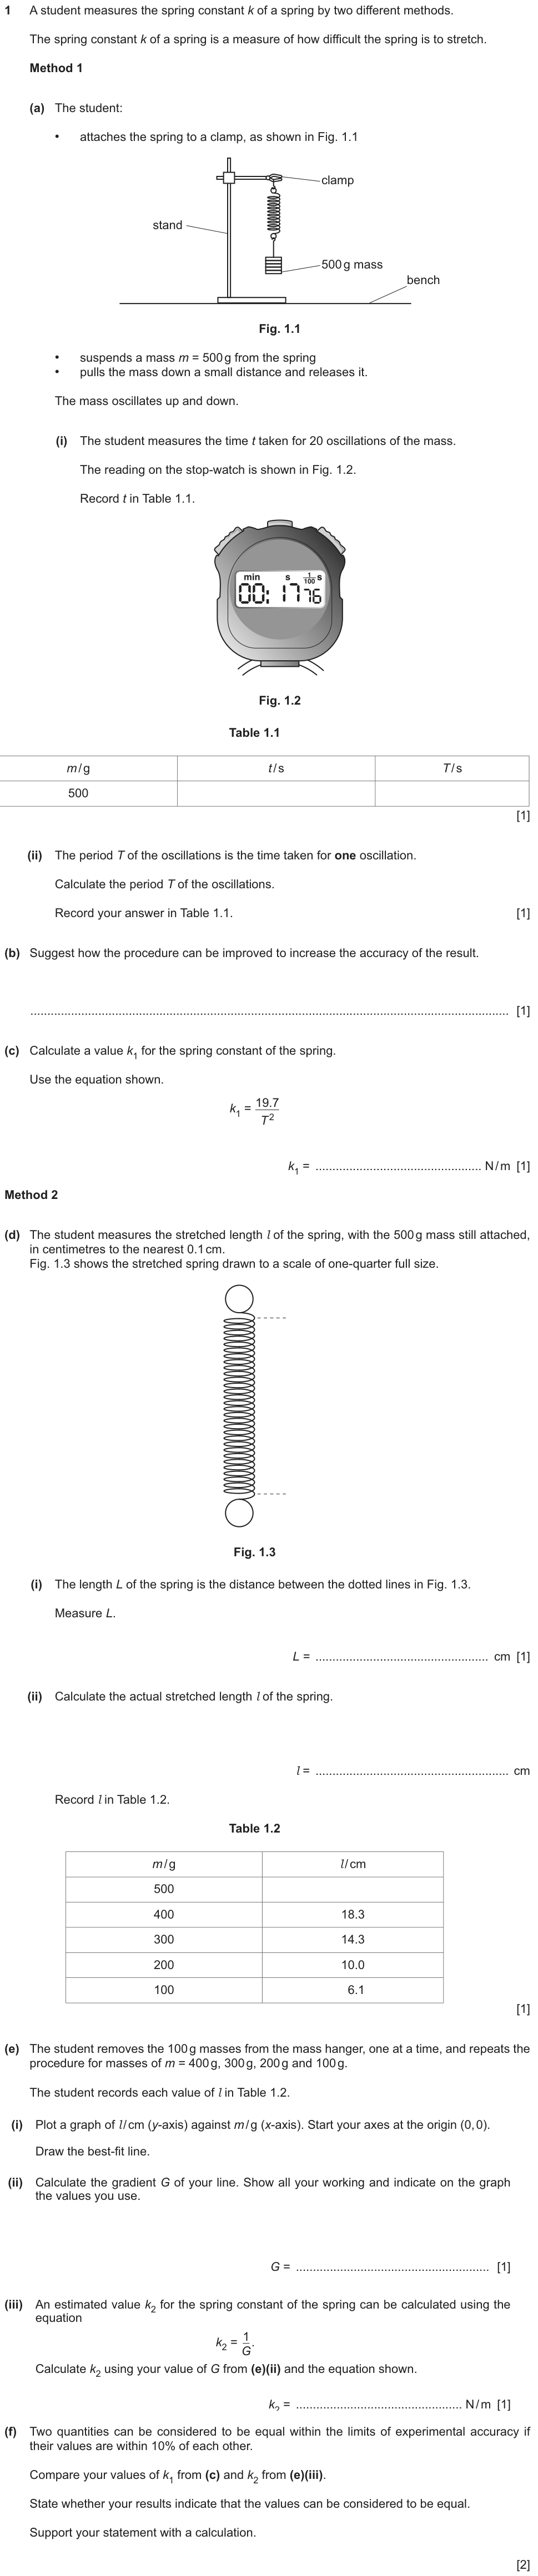
How to start: Method 1 is a reading and two calculations. Method 2: measure L on the quarter-size drawing (5.6 cm) and MULTIPLY by 4. Part (f) is the 10% test: statement + calculation.
✓ Show the answer have a go on paper first
- (a)(i) \(t=17.76\) s. (ii) \(T=17.76\div20=0.888\) s.
- (b) Time a greater number of oscillations (e.g. 40): the reaction-time error is shared over more swings. (Repeating and averaging was also credited, but the report calls more oscillations the better answer.)
- (c) \(k_1=\dfrac{19.7}{0.888^2}=25.0\) N/m.
- (d)(i) \(L=5.6\) cm. (ii) Quarter size, so \(l=5.6\times4=22.4\) cm.
- (e)(i) Plot l (up) against m (across) from the origin; the five points lie on a straight line.
l against m: a straight line (not forced through the origin) and a large gradient triangle. - (e)(ii) Triangle from 150 g to 450 g on the line: \(G=0.0409\) cm/g. (iii) \(k_2=1/G=24.4\) N/m.
- (f) \(\dfrac{25.0-24.4}{25.0}\times100=2\%\): within 10%, so yes, the values can be considered equal.
| Part | Answer / working | Marks | Guidance |
|---|---|---|---|
| (a)(i) | 17.76 (s) | B1 | |
| (a)(ii) | T correct from your value, expect 0.888 | B1 | |
| (b) | time a greater number of oscillations | B1 | |
| (c) | k₁ correct, expect 25.0 | B1 | |
| (d)(i) | 5.6 (cm) | B1 | |
| (d)(ii) | 22.4 (cm) / your (d)(i) × 4 | B1 | |
| (e)(i) | appropriate scales (plots occupying at least ½ grid) | B1 | |
| plots all correct to ½ small square and precise plots | B1 | ||
| well-judged line and thin line | B1 | ||
| (e)(ii) | indication on the graph of how the gradient was found, and Δy/Δx shown | B1 | |
| (e)(iii) | k₂ = 23.5 to 26.4 inclusive | B1 | |
| (f) | statement to match your values of k₁ and k₂ | B1 | |
| values used in a calculation to justify the statement | B1 | ||
| Total: 13 marks | |||
Examiner tip The report: some divided 20 by the time, some divided 5.6 by 4, and some forced the line through the origin. 5.60 cm was not accepted for (d)(i).
'Are the values equal?' - what earns both marks
Two quantities can be considered to be equal within the limits of experimental accuracy if their values are within 10% of each other. Compare your values of k₁ and k₂. State whether your results indicate that the values can be considered to be equal. Support your statement with a calculation.
- a statement that matches your own values (yes or no)
- a calculation using both values: % difference compared with 10%
- "yes, they are similar" with no numbers
- a statement that contradicts your own calculation
- "no, because they are not exactly the same"
The idea is the 10% limit, and the scheme marks the statement against YOUR values, so a wrong k₂ can still score both marks here if the statement and calculation agree with it.
From: 0625/62/M/J/24 Q1(f) scheme; same wording in 0625/61/M/J/25 Q3(e), 5054/41/M/J/24 Q3(d)
Type 1 Equal within the limits?
"State whether … can be considered to be equal. Support your statement with a calculation." (2 marks)
Spot it "within 10%", "limits of experimental accuracy".
- % difference.
- Compare with 10%.
- Yes / no matching the numbers.
Type 2 Describe the relationship
"Describe the relationship between … and … ." (1-2 marks)
Spot it "relationship", "trend".
- As X increases, Y …
- Add the rate (faster/slower) if the numbers show it.
Type 3 Source of inaccuracy
"Suggest a source of inaccuracy in this experiment, even when carefully done." (1 mark)
Spot it "even when carried out carefully".
- A limitation of the METHOD (ray thickness, reaction time, heat loss).
Type 4 Improvement
"Suggest how the procedure can be improved to increase the accuracy." (1 mark)
Spot it "improve", "more accurate".
- Specific change + why it helps.
Mistakes to avoid
- ✗ "human error"✓ "reaction time when starting and stopping the stopwatch"Be specific to the experiment.
- ✗ "repeat the experiment"✓ "repeat each reading and take the average" / "time 40 oscillations"
- ✗ "yes, they are close"✓ "yes: 2% difference, within 10%"The calculation is the second mark.
- ✗ a conclusion from theory✓ a conclusion from the data on the pagePredictions are not conclusions.
- ✗ "y is proportional to x" for any straight line✓ only if the line passes through the origin
Summary
- A conclusion names both variables, matches the data and quotes numbers when asked.
- Equal within the limits of experimental accuracy = within 10%; always show the percentage.
- Anomalies: leave out of averages, circle on graphs, repeat.
- Sources of error are specific to the method; improvements fix them and say why.
If you see …
- "Support your statement with a calculation"% difference vs 10%.
- "even when carried out carefully"a limitation of the method.
- "repeat"say what you repeat and that you average.
Practice
Practice: easy, medium, hard
Easy
Show answer
Answer 5%
Show answer
Answer 18.0
Show answer
Answer systematic
Medium
Guide me
What is it asking? yes or no, with %
What do we know? difference 0.16
Plan ÷ 1.52 × 100, compare with 10
Show answer
Answer No: (1.52 − 1.36)/1.52 × 100 = 10.5%, more than 10%
Guide me
What is it asking? a limitation of the method
What do we know? the image goes in and out of focus gradually
Plan judging 'sharpest'
Show answer
Answer it is difficult to judge exactly where the image is sharpest
Guide me
What is it asking? a specific change
What do we know? it should make judging easier
Plan brightness / careful movement
Show answer
Answer darken the room (brighter image) and move the screen slowly back and forth, so the sharpest position is easier to judge
Hard
Show answer
Answer Yes: y/x is constant to within 4% (1.97 to 2.05), within 10%
| Part | Answer / working | Marks | Guidance |
|---|---|---|---|
| yes | B1 | ||
| y/x values quoted, spread within 10% | B1 | ||
| Total: 2 marks | |||
Show working
- \(1.1\div9.8\times100=11.2\%\)
Answer No: (9.8 − 8.7)/9.8 × 100 = 11%
| Part | Answer / working | Marks | Guidance |
|---|---|---|---|
| no | B1 | ||
| 11% (> 10%) | B1 | ||
| Total: 2 marks | |||
Show answer
Answer the starting temperature affects the rate of cooling (hotter water cools faster), so the difference in cooling is not only due to the variable tested; start both at the same temperature
| Part | Answer / working | Marks | Guidance |
|---|---|---|---|
| starting temperature affects the rate of cooling | B1 | ||
| start both at the same temperature | B1 | ||
| Total: 2 marks | |||
Can I do this?
- I write conclusions that name both variables and match the data.
- I can decide if two values are equal within 10%, with a calculation.
- I can spot an anomaly and say what to do with it.
- I can name a specific source of error and say if it is random or systematic.
- I can suggest a specific improvement and say why it helps.
Anything unticked: revise that section first. All ticked: take the quiz.
Quiz
The multiple-choice and guided questions need JavaScript. The concept checks and exam practice below work without it.
Your progress on this note is saved when JavaScript is on.