
Practical skills: Paper 6 Alternative to Practical
Variables and planning an investigation
In this note
- AO3Identify the independent, dependent and control variables, and say how and why to control each.
- AO3Suggest a sensible number (at least 5) and range of values for the independent variable.
- AO3Choose apparatus and techniques, describe the procedure, and say how to record and process the results.
- AO3Make a reasoned prediction; identify risks and safety precautions.
- AO3Write a full-mark answer to the planning question (7 marks).
Before you start: tables and conclusions.
Rules to learn
Independent, dependent and control variables
A fair test changes ONE thing and measures its effect, with everything else kept the same. If two things change, you cannot tell which one caused the result ("a small number of candidates opted to change both possible variables at the same time - these plans were not valid", 5054 Nov 2023 report).
| Investigation | Independent (change) | Dependent (measure) | Control (keep the same) |
|---|---|---|---|
| How does the length of a pendulum affect its period? | length of string | time for 20 swings → period | mass of the bob; angle of release |
| How does insulation thickness affect cooling? | number of layers of insulation | temperature drop in a fixed time (or time to cool a fixed amount) | volume of water; starting temperature; same beaker; room temperature |
| How does the diameter of a wire affect its resistance? | diameter | resistance = V/I | length of wire; material of wire; temperature (switch off between readings) |
| How does the height of a ramp affect how far a ball rolls? | height of the ramp | distance travelled on the floor | same ball; same release point; same floor surface |
| How does the colour of a container affect heating by a lamp? | colour of the surface | temperature rise in a fixed time | distance from the lamp; same lamp; same volume and starting temperature of water |
Try it yourself
Show answer
Answer the time taken
Show answer
Answer the same trolley (mass) / the same starting point / the same length of ramp
How many readings, and which values?
General methodHow to choose the values of the independent variable
- Take at least 5 different values (enough for a graph).
- Spread them over a wide range the apparatus can really give: lengths 20 cm to 100 cm on a metre rule; masses 100 g to 500 g; temperatures 30 °C to 80 °C.
- Use equal steps (20, 40, 60, 80, 100 cm) unless the graph will curve - then add extra readings where it bends.
- Repeat each reading and take the average.
A question may give a few readings and ask for more: give values inside the range the apparatus allows and not beyond a limit stated in the question (0625/61/O/N/24 Q1(h): "at least 3 additional values, none greater than distance x").
Try it yourself
Show answer
Answer 20, 40, 60, 80, 100 cm (any five well spread, 0 < l ≤ 100)
Reasoned predictions
A prediction says what you expect AND why, from physics you know: "I predict the thicker wire has a smaller resistance, because there is more area for the current to flow through." A prediction is not a conclusion: in the planning answer you must say how you would use the results to find out, not what you expect them to be.
Hazards and precautions
| Hazard | Precaution |
|---|---|
| hot water / heater can scald or burn | handle the beaker with a cloth or tongs; stand it on a heat-proof mat; don't move it while hot |
| masses or a heavy load can fall | keep feet clear; place a box of sand or a tray beneath the masses |
| thin wire gets hot with a large current | switch off between readings; use a protective resistor / low current |
| glass can break; springs can snap back | wear eye protection (goggles) |
| a ray box lamp gets hot | don't touch the lamp housing |
Many planning questions say "You do not need to write about safety precautions" - then don't: it earns nothing and uses time.
The planning question: a full-mark answer
The last question asks you to plan an investigation you have not seen. It is worth 7 marks and the marks are almost always given for the same points. The question lists them as bullet points: answer each bullet, in order, with a heading.
| Marking point | What earns it | Example (diameter vs resistance) |
|---|---|---|
| Apparatus | ONLY the extra apparatus needed to measure the IV and DV (a circuit diagram if asked) | micrometer (or ruler and many turns) for the diameter; ammeter and voltmeter |
| Method | what you measure (DV), and "repeat for different values of the independent variable" | measure d; record V and I; repeat with at least 4 other diameters |
| Control variable | one (or two) that really matter for THIS IV | same length and same material of wire |
| Table | columns for the IV and the DV, with units in the headings | d / mm · V / V · I / A · R / Ω |
| Conclusion | plot a graph of DV against IV (axes named) or compare the readings to see if/how the IV affects the DV | plot a graph of R against d |
| Extra point (0625) | a second control variable, OR at least 5 sets of readings, OR repeat each reading and average | take at least 5 diameters |
General methodHow to write any planning answer
- Read the bullet points in the question; use them as your headings.
- Apparatus: add only what you need beyond the list given (a ruler, a stopwatch, a balance, a protractor…). Don't copy the list.
- Method: 3-4 short numbered steps - set up, measure the DV, change the IV, repeat for at least 5 values (each repeated and averaged).
- Control: "Keep the same …" - exact, and right for your IV.
- Table: draw it, with headings and units; leave it empty.
- Conclusion: "Plot a graph of [DV] against [IV]" or "Compare the values of [DV] for each [IV] to see whether [IV] affects [DV]". No predictions.
Example Plan (our own question): how does the height of a ramp affect the distance a ball rolls along the floor after leaving it? Apparatus given: ramp, ball, blocks to raise the ramp.
Answer each bullet in order.
- Apparatus: a metre rule (to measure the height) and a measuring tape (for the distance).
- Method: set the ramp height h; release the ball from the same marked point; measure the distance d it travels on the floor until it stops. Repeat each height three times and average. Repeat for at least 5 heights (e.g. 5, 10, 15, 20, 25 cm).
- Control: same ball; same release point on the ramp; same floor surface.
- Table: h / cm · d₁ / cm · d₂ / cm · d₃ / cm · average d / cm.
- Conclusion: plot a graph of average d against h to see how d changes with h.
Answer every marking point covered in five short headed sections
From the past papers
Past paper 1
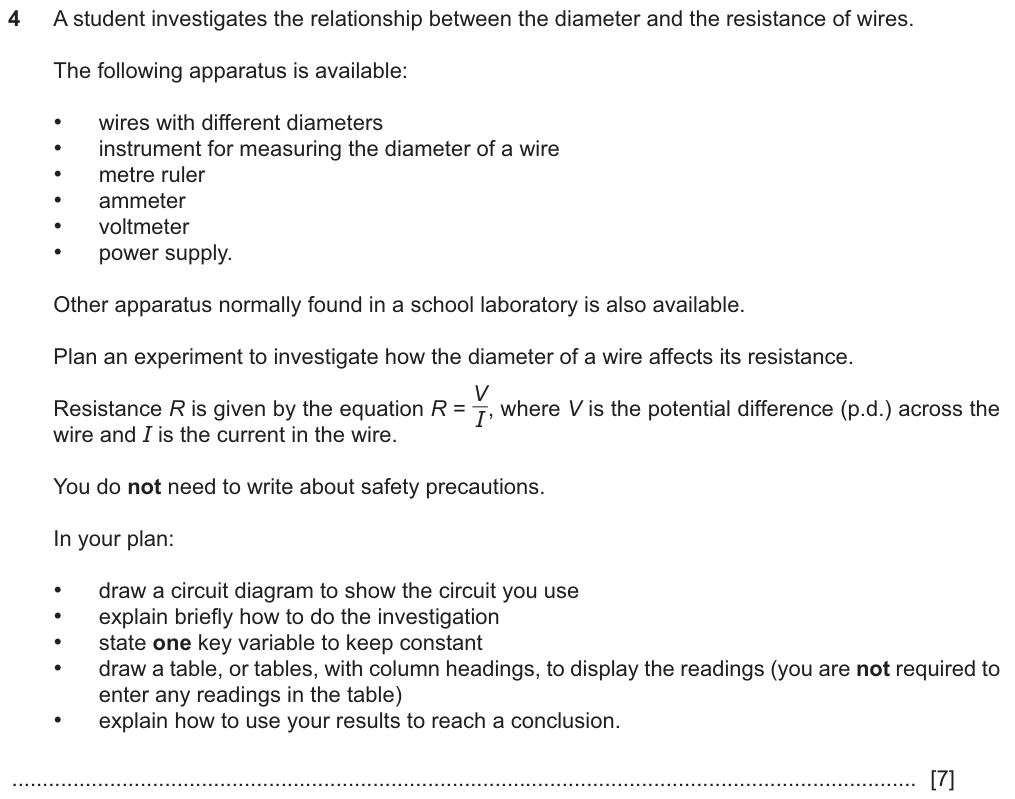
How to start: Five bullets = five headings. The circuit is the usual one: ammeter in series, voltmeter across the wire. The IV is the diameter, the DV is R = V/I.
✓ Show the answer have a go on paper first
- Circuit: power supply, switch, ammeter and the test wire in series; voltmeter connected across the test wire.
Ammeter in series with the wire; voltmeter in parallel with (across) the wire. - Method: measure the diameter d of the wire with the measuring instrument. Close the switch; record V and I; calculate R = V/I. Repeat with at least four other wires of different diameters.
- Keep constant: the length of wire between the connections (and the material).
- Table: d / mm · V / V · I / A · R / Ω.
- Conclusion: plot a graph of R against d (or compare the values of R for each d to see how the diameter affects the resistance).
| Part | Answer / working | Marks | Guidance |
|---|---|---|---|
| MP1 | correct circuit diagram (ammeter in series, voltmeter across the wire, correct symbols) | B1 | |
| MP2 | measure wire diameter AND measure / record voltage and current | B1 | |
| MP3 | calculate / work out the resistance of the wire | B1 | |
| MP4 | repeat for at least two other diameters of wire | B1 | |
| MP5 | variable kept constant: length / material of wire | B1 | |
| MP6 | table with columns for diameter, voltage, current and resistance, each with quantity and unit | B1 | |
| MP7 | plot a graph of resistance against diameter OR compare the values of diameter and resistance in the table | B1 | |
| Total: 7 marks | |||
Examiner tip Every mark is for something you would actually do or write down. No mark for theory about why thicker wires conduct better.
Past paper 2
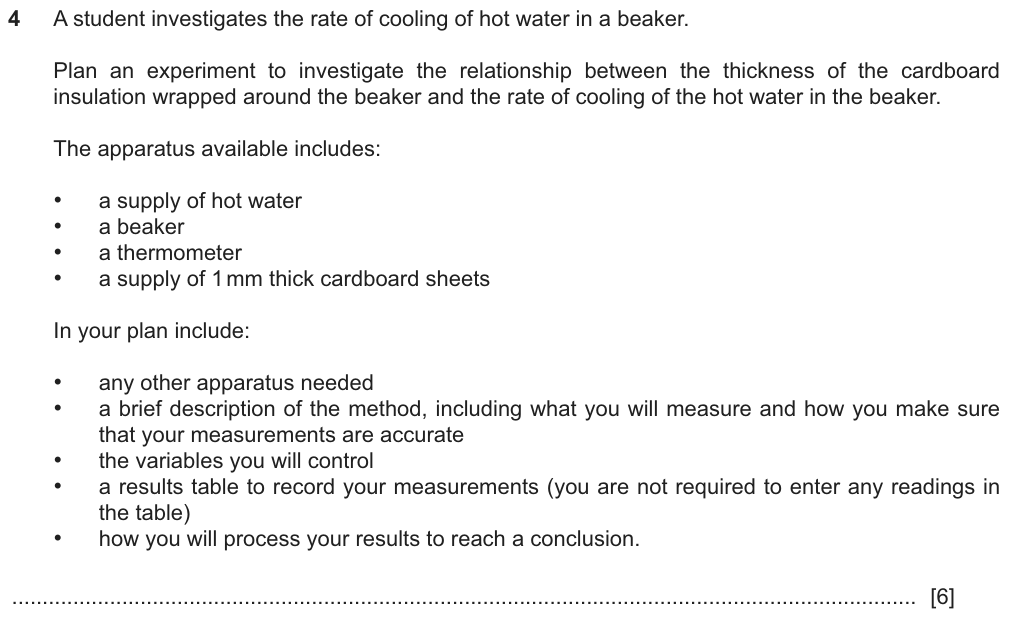
How to start: The IV is the thickness (number of 1 mm sheets wrapped round). The DV is how fast the water cools: a temperature drop in a fixed time, or the time for a fixed drop. You need a timer.
✓ Show the answer have a go on paper first
- Apparatus: a stopwatch (and a measuring cylinder for the water).
- Method: wrap 1 sheet of cardboard round the beaker; pour in hot water; read the starting temperature, then the temperature again after 5 minutes (stir, read at eye level). Repeat with 2, 3, 4 and 5 sheets.
- Control: the same volume of water; the same starting temperature; the same time interval; the same room temperature.
- Table: number of sheets (thickness / mm) · starting θ / °C · θ after 5 min / °C · fall in θ / °C.
- Conclusion: plot a graph of the temperature fall (or rate of cooling) against the thickness and see how it changes.
| Part | Answer / working | Marks | Guidance |
|---|---|---|---|
| MP1 | stopwatch / stopclock / timer | B1 | |
| MP2 | time the hot water cooling | B1 | |
| MP3 | at least 2 different thicknesses of cardboard used | B1 | |
| MP4 | control one of: same initial temperature / same volume or mass of water / same range of temperatures / same time of cooling | B1 | |
| MP5 | table columns: thickness or number of sheets, temperature and / or time, with units | B1 | |
| MP6 | plot a graph or bar chart of thickness / number of sheets against temperature or time, OR compare | B1 | |
| Total: 6 marks | |||
Examiner tip 5054 plans are 6 marks: apparatus, method, enough values, a control, the table, the conclusion.
The method mark: 'repeat' needs to say what changes
Plan an experiment to investigate how the diameter of a wire affects its resistance … explain briefly how to do the investigation.
- "repeat with wires of different diameters"
- "repeat for at least 4 other diameters"
- "repeat the experiment"
- "repeat and average" (with no new value of the IV)
- a prediction of what will happen
A plan is about changing the independent variable. "Repeat the experiment" could mean doing the same reading again, so it does not show the IV changing. Predictions do not say how the results lead to a conclusion.
From: 0625/61/M/J/25 Q4 scheme; 0625 June 2024 report on Q4
Type 1 Plan an investigation
"Plan an experiment to investigate … In your plan: …" (7 marks)
Spot it the last question.
- Headings from the bullets.
- Extra apparatus only.
- Measure DV; change IV; ≥ 5 values; repeat + average.
- Control variable(s).
- Empty table with units.
- Graph of DV against IV / compare.
Type 2 Control variables in a given experiment
"State two variables that should be kept constant." (2 marks)
Spot it "kept constant", "control".
- Exact and relevant: "the same volume of water".
Type 3 More values
"Suggest three more values of … the student could use." (2 marks)
Spot it a short table to extend.
- Inside the apparatus's range and the limit given.
- Spread out, not repeats.
Mistakes to avoid
- ✗ copying the apparatus list✓ only the extra apparatusEarns nothing (0625 June 2024 report).
- ✗ changing two variables at once✓ change one; keep the other constantThe plan is not valid.
- ✗ "keep the mass the same"✓ "use the same mass of water"Say which mass.
- ✗ "repeat the experiment"✓ "repeat for at least five different diameters"
- ✗ a prediction as the conclusion✓ "plot a graph of R against d"Predictions are not credited.
- ✗ a table with no units✓ d / mm, R / ΩUnits are part of the table mark.
Summary
- Change ONE variable (IV), measure one (DV), keep everything else the same (named exactly).
- At least 5 values over a wide, realistic range; repeat each and average.
- Planning answer: apparatus → method → control → table → conclusion, following the bullets.
- Conclusion = graph of DV against IV, or compare readings - never a prediction.
If you see …
- "Plan an experiment"use the bullets as headings.
- "other apparatus"only what is not listed.
- "explain how to reach a conclusion"graph of DV against IV.
Practice
Practice: easy, medium, hard
Easy
Show answer
Answer the temperature of the water
Show answer
Answer the time for the sugar to dissolve
Show answer
Answer 5
Medium
Guide me
What is it asking? a table
What do we know? IV first, repeats, average, calculated
Plan units in every heading
Show answer
Answer l / cm · t₁ / s · t₂ / s · average t / s · T / s
Guide me
What is it asking? two controls
What do we know? what else changes cooling?
Plan amount of water, starting temperature, surroundings
Show answer
Answer the same volume of water; the same starting temperature (also: same beaker, same time, same room temperature)
Guide me
What is it asking? apparatus for IV and DV
What do we know? IV = angle, DV = time
Plan one instrument each
Show answer
Answer a protractor (for the angle) and a stopwatch (for the time)
Hard
Show answer
Answer Apparatus: metre rule (and set square). Method: measure the unstretched length; add 100 g; measure the new length; extension = new − original; repeat adding 100 g up to 500 g. Control: same spring; ruler fixed in place, vertical. Table: m / g · l / cm · e / cm. Conclusion: plot a graph of e against m.
| Part | Answer / working | Marks | Guidance |
|---|---|---|---|
| metre rule (+ set square / pointer) | B1 | ||
| measure length, add masses, find extension | B1 | ||
| at least 5 different masses | B1 | ||
| control: same spring | B1 | ||
| table m / g, l / cm, e / cm | B1 | ||
| graph of e against m | B1 | ||
| Total: 6 marks | |||
Show answer
Answer two independent variables change together, so a change in resistance cannot be put down to either one; change one (e.g. length) and keep the other (diameter) constant
| Part | Answer / working | Marks | Guidance |
|---|---|---|---|
| two variables changed: cannot tell which causes the effect | B1 | ||
| change one, keep the other constant | B1 | ||
| Total: 2 marks | |||
Can I do this?
- I can name the IV, DV and exact control variables of any investigation.
- I choose at least 5 values over a sensible range and repeat each.
- I can make a reasoned prediction and know it is not a conclusion.
- I can give a hazard and a precaution for heating, masses and circuits.
- I can write a full-mark plan following the bullets: apparatus, method, control, table, conclusion.
Anything unticked: revise that section first. All ticked: take the quiz.
Quiz
The multiple-choice and guided questions need JavaScript. The concept checks and exam practice below work without it.
Your progress on this note is saved when JavaScript is on.